4.9.3 SeRP summary
serp_summary
serp_summary summarizes the results of one serp_peak run or one pairwise serp_overlap comparison. It automatically detects the result type from the input prefix and writes summary tables and figures.
Function
Use this command when you want to:
- summarize one
serp_peakresult (peak mode): peak statistics, normalized peak matrices, distribution tables, and summary figures; - summarize one pairwise
serp_overlapcomparison (overlap mode): shared/specific peak classification, significance counts, transcript/gene summaries, shared clusters, and summary figures; - leave the mode unspecified and let
serp_summarydetect whether the input prefix belongs toserp_peakorserp_overlap.
Input
The command takes the output prefix previously used by serp_peak or serp_overlap (-i).
Peak mode requires:
Overlap mode requires:
If the input prefix matches both peak and overlap outputs, --mode must be set explicitly.
Parameters
| Parameter | Required | Meaning |
|---|---|---|
-i |
yes | Input prefix previously used by serp_peak or serp_overlap. |
--mode |
no | Summary mode. auto detects serp_peak versus serp_overlap outputs. Default: auto. |
--significance-metric |
no | Metric used only to annotate statistical significance in overlap mode: bhfdr, pvalue, or none. Missing values are classified as untested. Default: bhfdr. |
--significance-cutoff |
no | Maximum BHFDR/P-value annotated as significant in overlap mode. Default: 0.05. |
--top-specific-genes |
no | Maximum genes shown in the condition-specific peak-burden figure. Default: 20. |
-o |
no | Output prefix. Default: <input>_summary. |
--output-format |
no | Summary figure output format: pdf, png, or both. Default: pdf. |
--plot |
no | Generate summary figures in addition to summary tables. Pass --no-plot to write tables only. Default: True. |
--bins |
no | Peak-mode only. Number of normalized transcript bins. Default: 100. |
--max-heatmap-cells |
no | Peak-mode only. Maximum dense full-length heatmap cells. Default: 100000000. |
--chunksize |
no | Peak-mode only. Rows read per chunk from *_peaks_ratio.txt. Default: 500000. |
--font-size |
no | Base figure font size. Default: 9.0. |
--dpi |
no | PNG output resolution. Default: 300. |
Output
The output prefix is controlled by -o (default <input>_summary).
Peak mode
| Output | Description |
|---|---|
<prefix>.summary.txt |
Metric table summarizing the peak calling result. |
<prefix>.peaks.txt |
Peak-level summary table. |
<prefix>.transcripts.txt |
Transcript-level summary table. |
<prefix>.normalized_peak_matrix.txt |
Normalized peak matrix used for the heatmap. |
<prefix>.full_length_heatmap_order.txt |
Row order used for the full-length heatmap. |
<prefix>.peak_length_distribution.txt |
Peak-length distribution. |
<prefix>.peak_count_distribution.txt |
Distribution of peak counts. |
<prefix>.peak_region_distribution.txt |
Distribution of peak positions within transcripts. |
<prefix>.inter_peak_distance.txt |
Distances between adjacent peaks. Written only when non-empty. |
Peak-mode figures (--plot):
| Figure | Description |
|---|---|
<prefix>.summary_counts.<ext> |
Peak/transcript summary counts. |
<prefix>.peak_fold_distribution.<ext> |
Peak fold-enrichment distribution. |
<prefix>.peak_length_distribution.<ext> |
Peak-length distribution. |
<prefix>.peaks_per_transcript.<ext> |
Number of peaks per transcript. |
<prefix>.peak_region_distribution.<ext> |
Peak position distribution. |
<prefix>.peak_center_distribution.<ext> |
Peak-center distribution. |
<prefix>.peak_burden.<ext> |
Peak burden by transcript length. |
<prefix>.inter_peak_distance.<ext> |
Inter-peak distance distribution. |
<prefix>.normalized_peak_heatmap.<ext> |
Normalized peak matrix heatmap. |
<prefix>.full_length_peak_heatmap.<ext> |
Full-length peak heatmap. |
Overlap mode
| Output | Description |
|---|---|
<prefix>.summary.txt |
Comparison-level summary counts. |
<prefix>.peak_classification.txt |
Per-peak classification with shared/specific labels and significance annotations. |
<prefix>.category_summary.txt |
Counts of shared/specific peaks by condition. |
<prefix>.transcripts.txt |
Transcript-level summary of shared/specific peaks. |
<prefix>.genes.txt |
Gene-level summary of shared/specific peaks. |
<prefix>.shared.clusters.txt |
Shared peak clusters. |
<prefix>.region_summary.txt |
Peak-region summaries. |
<prefix>.overlap_quality_summary.txt |
Overlap-quality metrics between the two conditions. |
<prefix>.significant_specific.peaks.txt |
Combined significant condition-specific peaks. |
<prefix>.<label_a>.significant_specific.peaks.txt |
Significant peaks specific to condition A. |
<prefix>.<label_b>.significant_specific.peaks.txt |
Significant peaks specific to condition B. |
Overlap-mode figures (--plot):
| Figure | Description |
|---|---|
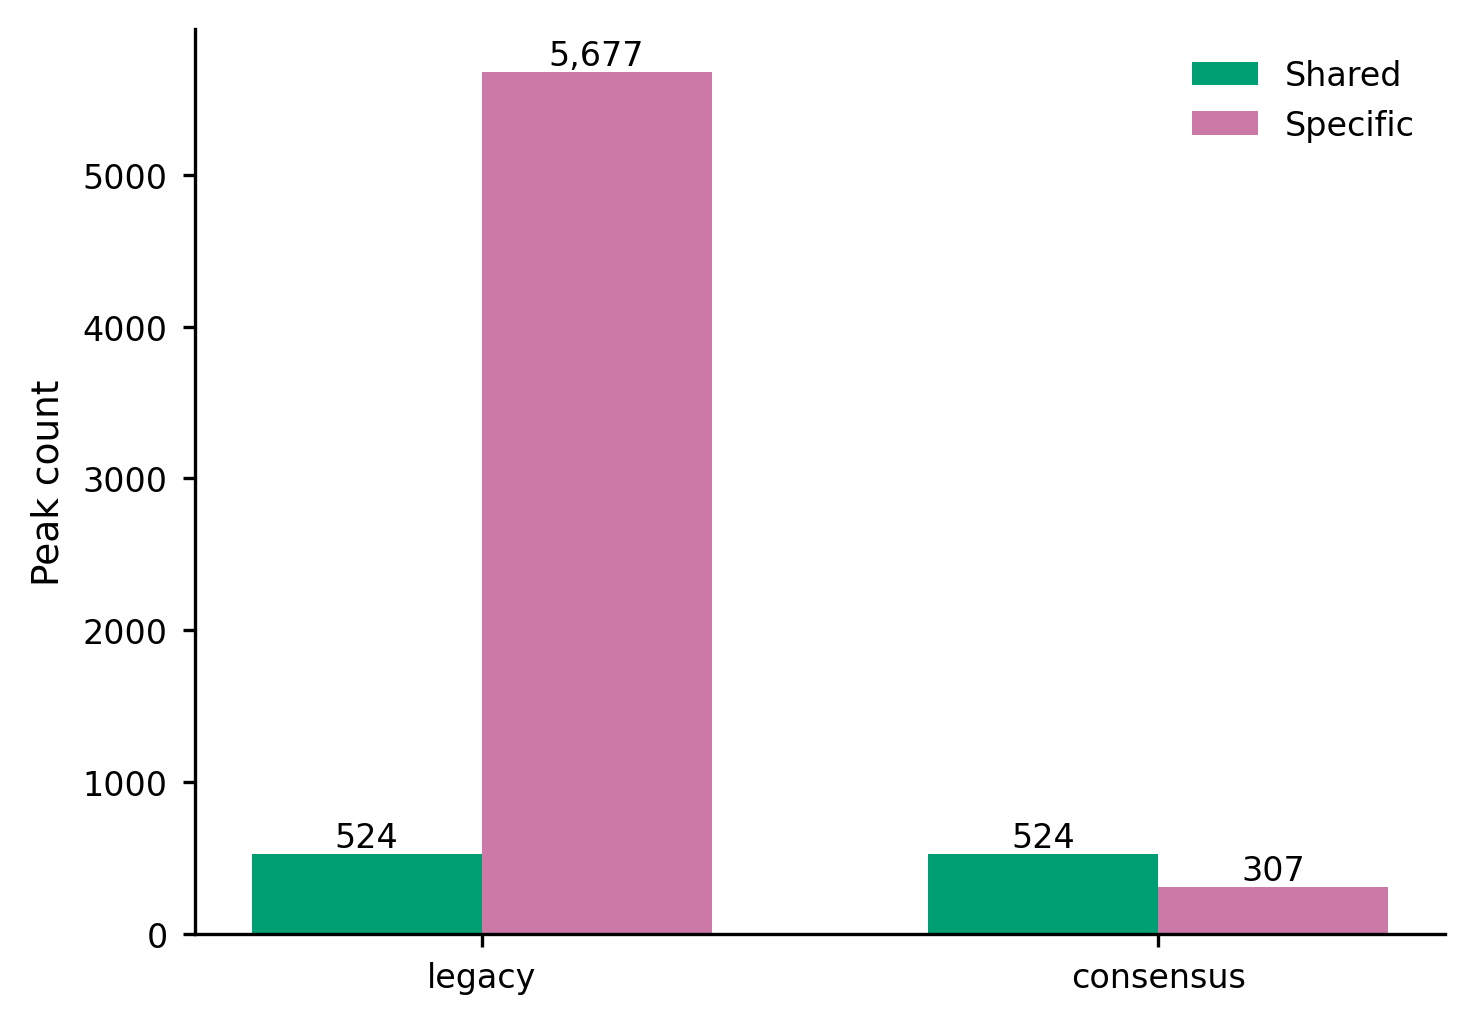
<prefix>.peak_category_counts.<ext> |
Shared/specific peak counts by category. |
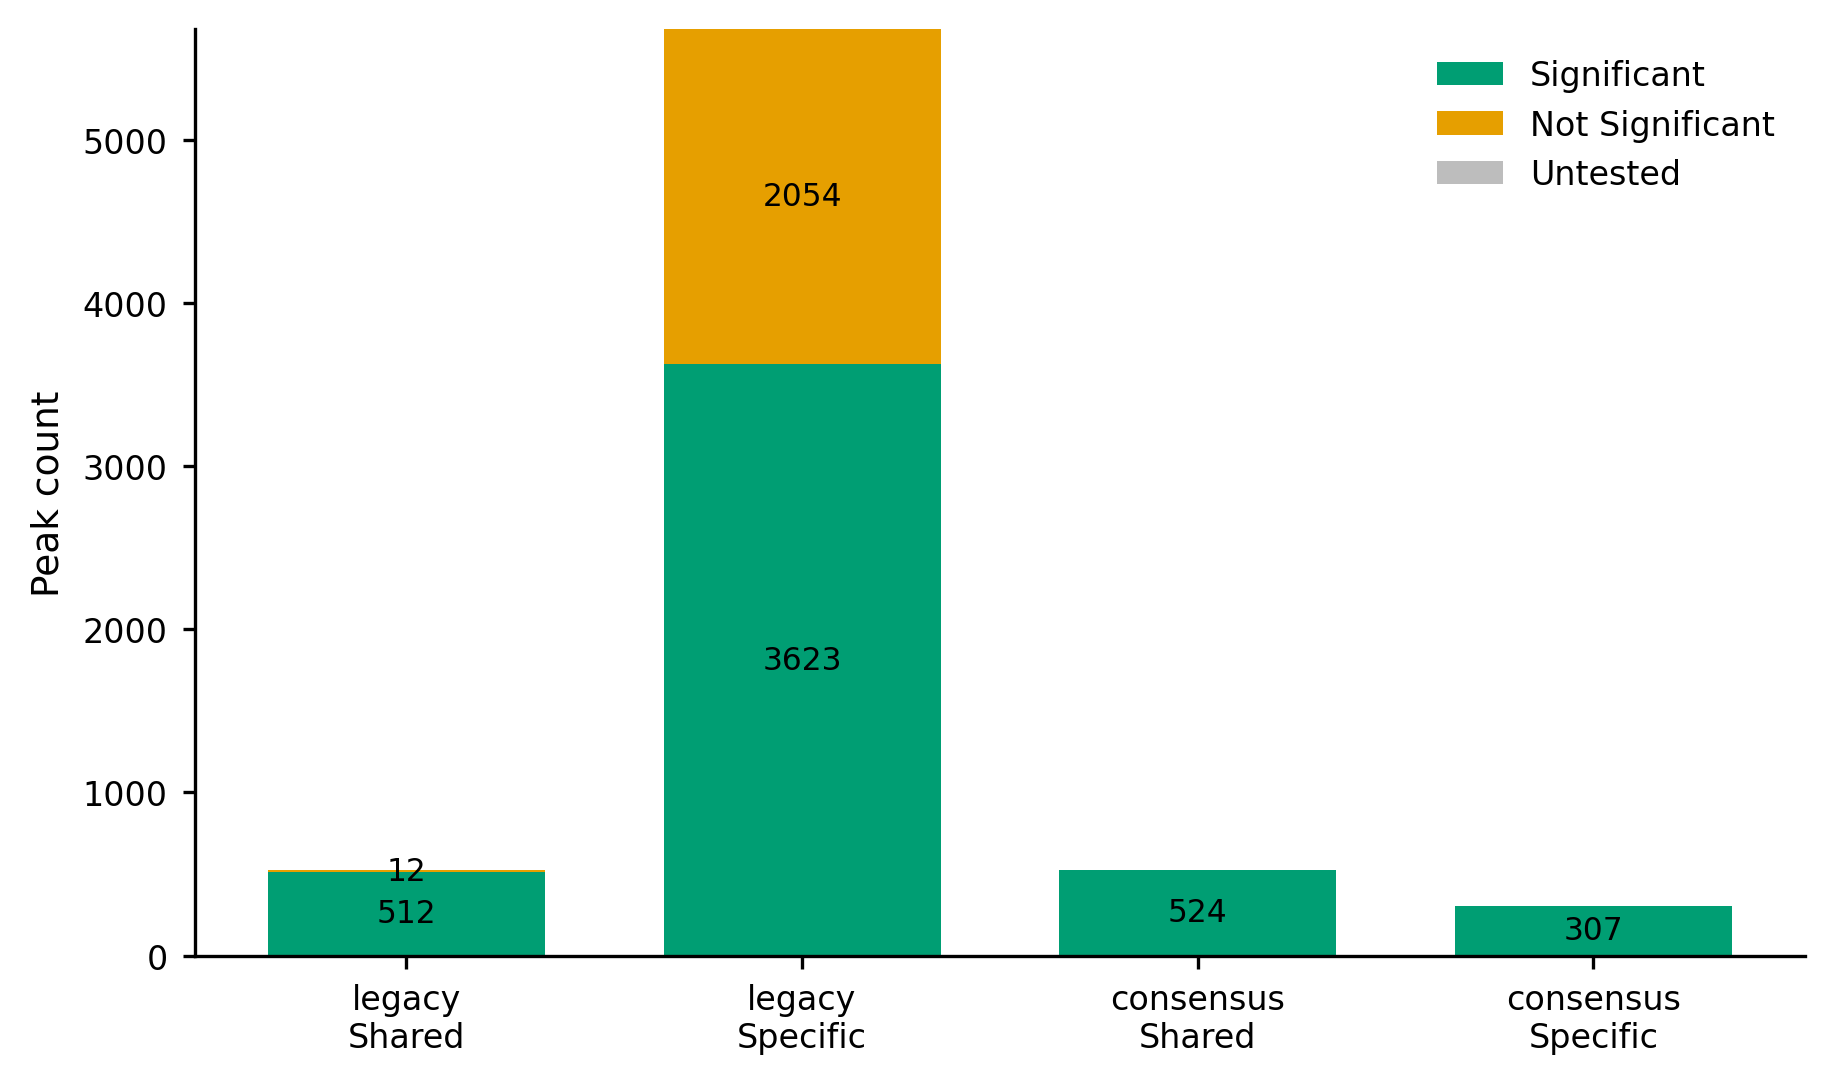
<prefix>.significance_counts.<ext> |
Significant versus non-significant counts. |
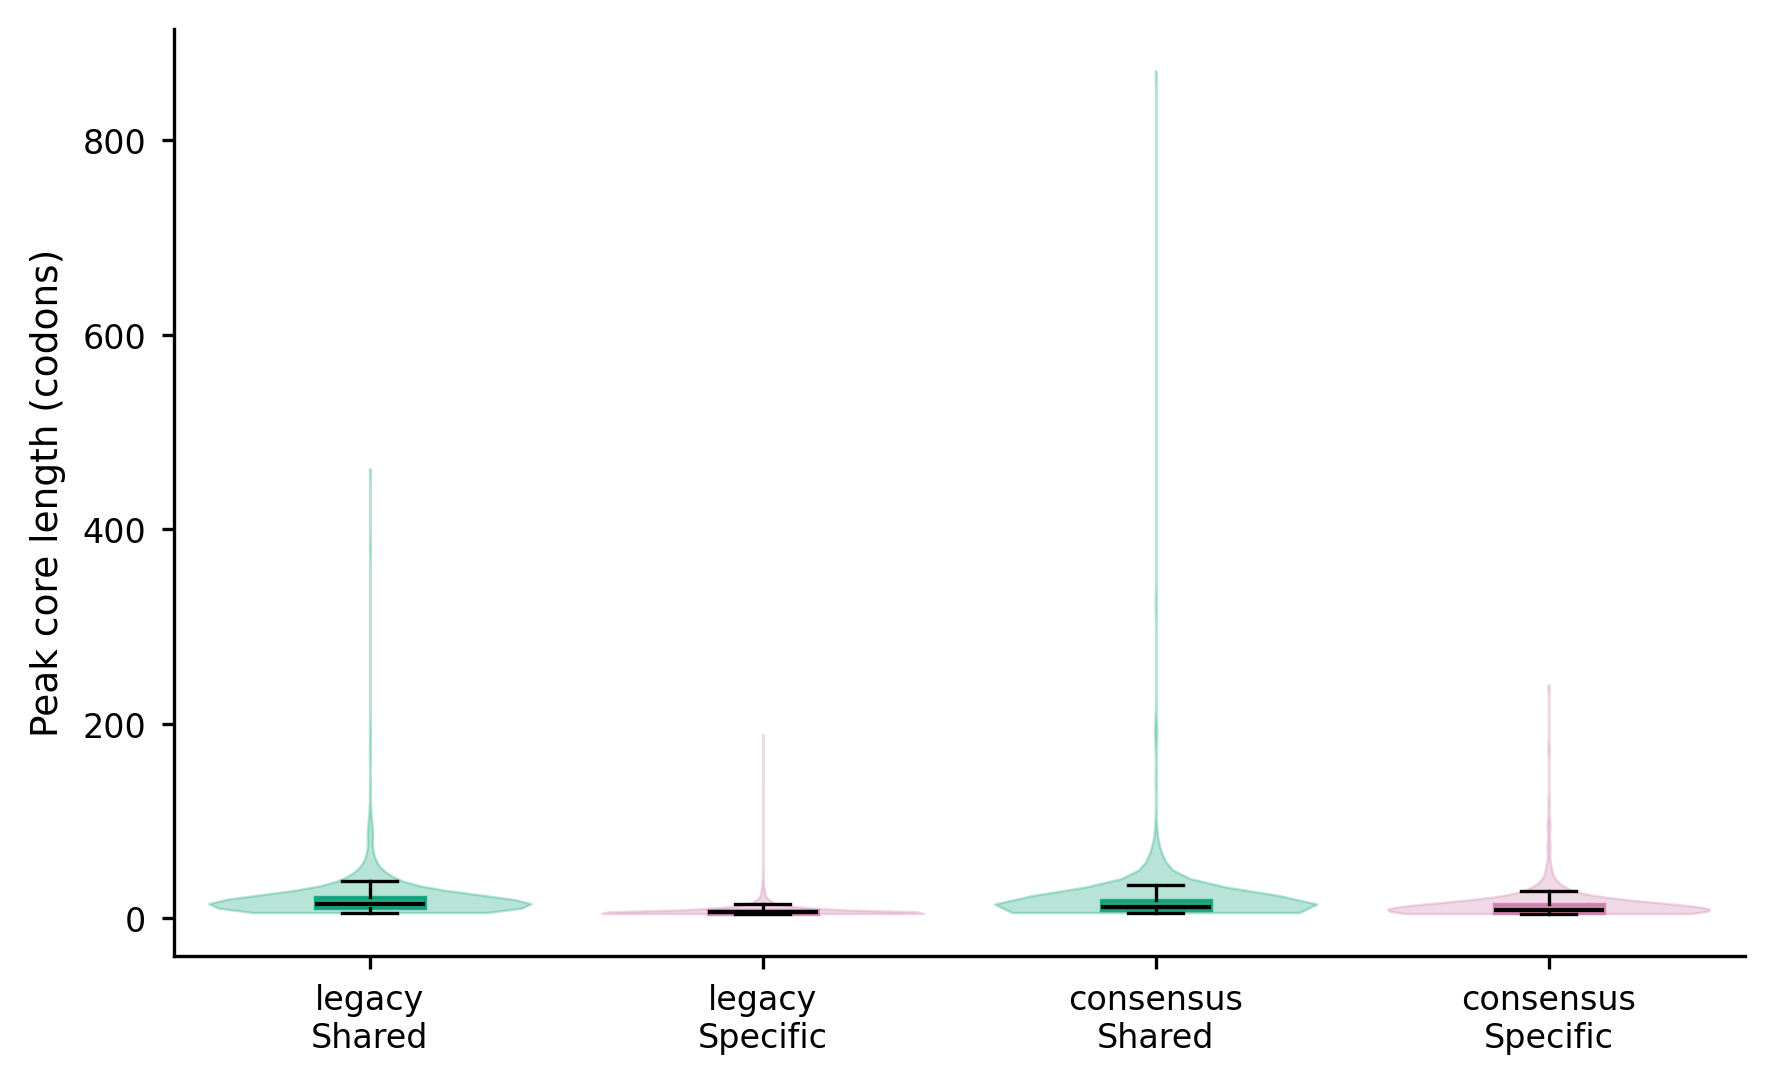
<prefix>.peak_length_by_category.<ext> |
Peak-length distributions by category. |
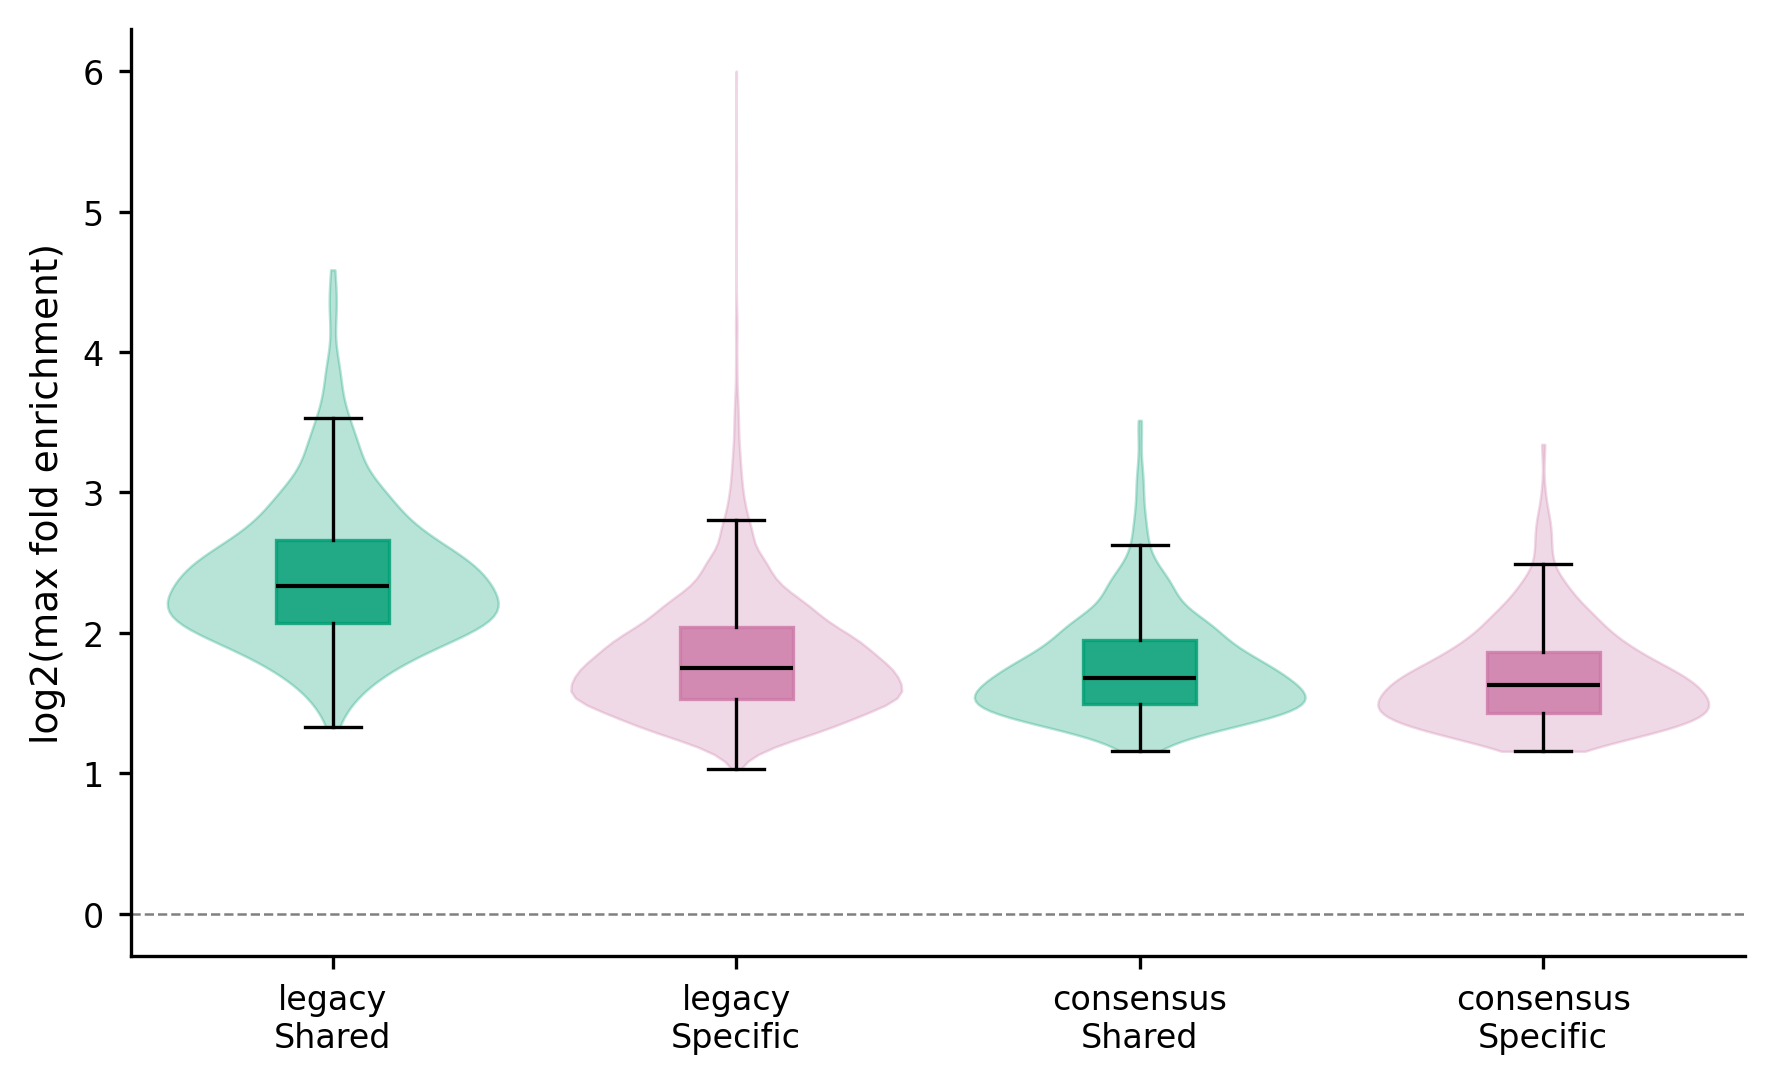
<prefix>.max_fold_by_category.<ext> |
Maximum fold enrichment by category. |
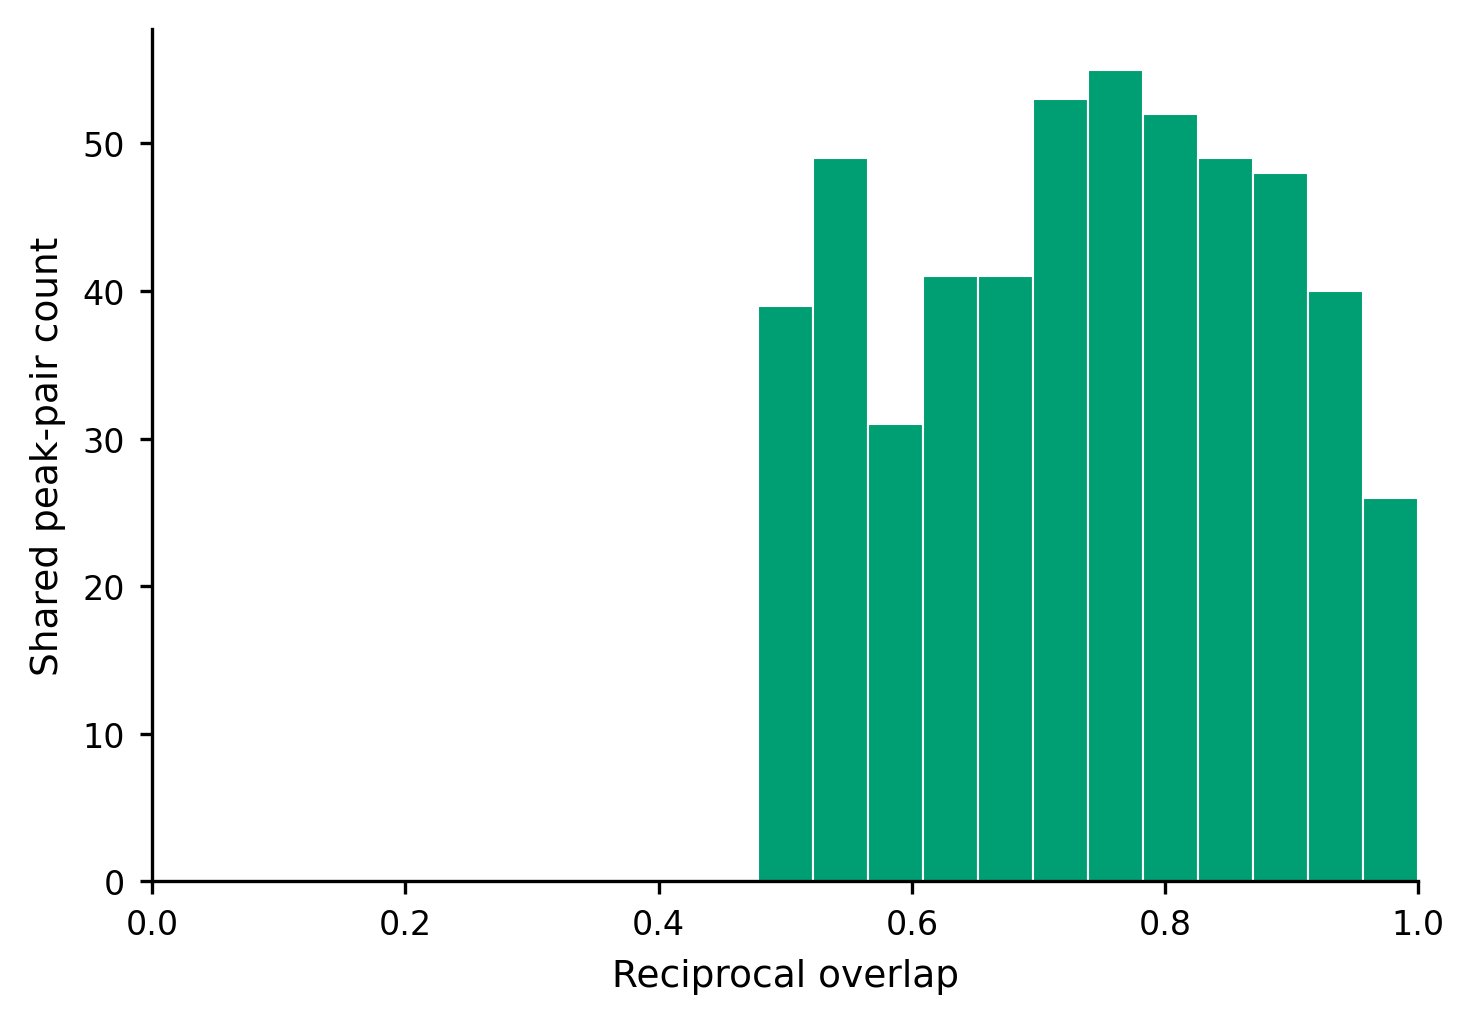
<prefix>.reciprocal_overlap_distribution.<ext> |
Reciprocal-overlap distribution. |
<prefix>.top_specific_genes.<ext> |
Top condition-specific genes by peak burden. Written only when genes carry condition-specific peaks. |
<ext> is the figure extension determined by --output-format (pdf, png, or both).
Examples
Summarize an overlap comparison with both PDF and PNG figures:
The figures below are the overlap-mode output of the command above:
Summarize a single serp_peak result with default settings:
Write tables only, without figures:
Notes
-imust be the exact prefix previously used byserp_peakorserp_overlap; the required input files are detected from it.- When the prefix matches both peak and overlap outputs,
--mode peakor--mode overlapmust be given explicitly. - The overlap-mode significance columns are annotation-only: they never filter peaks, and peaks with missing significance values are classified as untested.
- Peak mode reads
*_peaks_ratio.txtin chunks (--chunksize) and caps dense heatmap memory with--max-heatmap-cells. - The output directory of
-omust already exist.