4.5.7 Metaplot
Purpose
Generate metagene profiles around translation initiation sites (TIS) and translation termination sites (TTS) from a merged RPF density file, and optionally merge metaplot tables from multiple samples or analyses. Metaplot analysis helps evaluate positional density patterns, offset quality, initiation/termination enrichment, and possible boundary artifacts.
rpf_Metaplot     # Calculate TIS/TTS metaplot profiles and draw per-sample figures + heatmap
merge_metagene   # Merge *_tis_tts_metaplot.txt tables from multiple samples or analyses
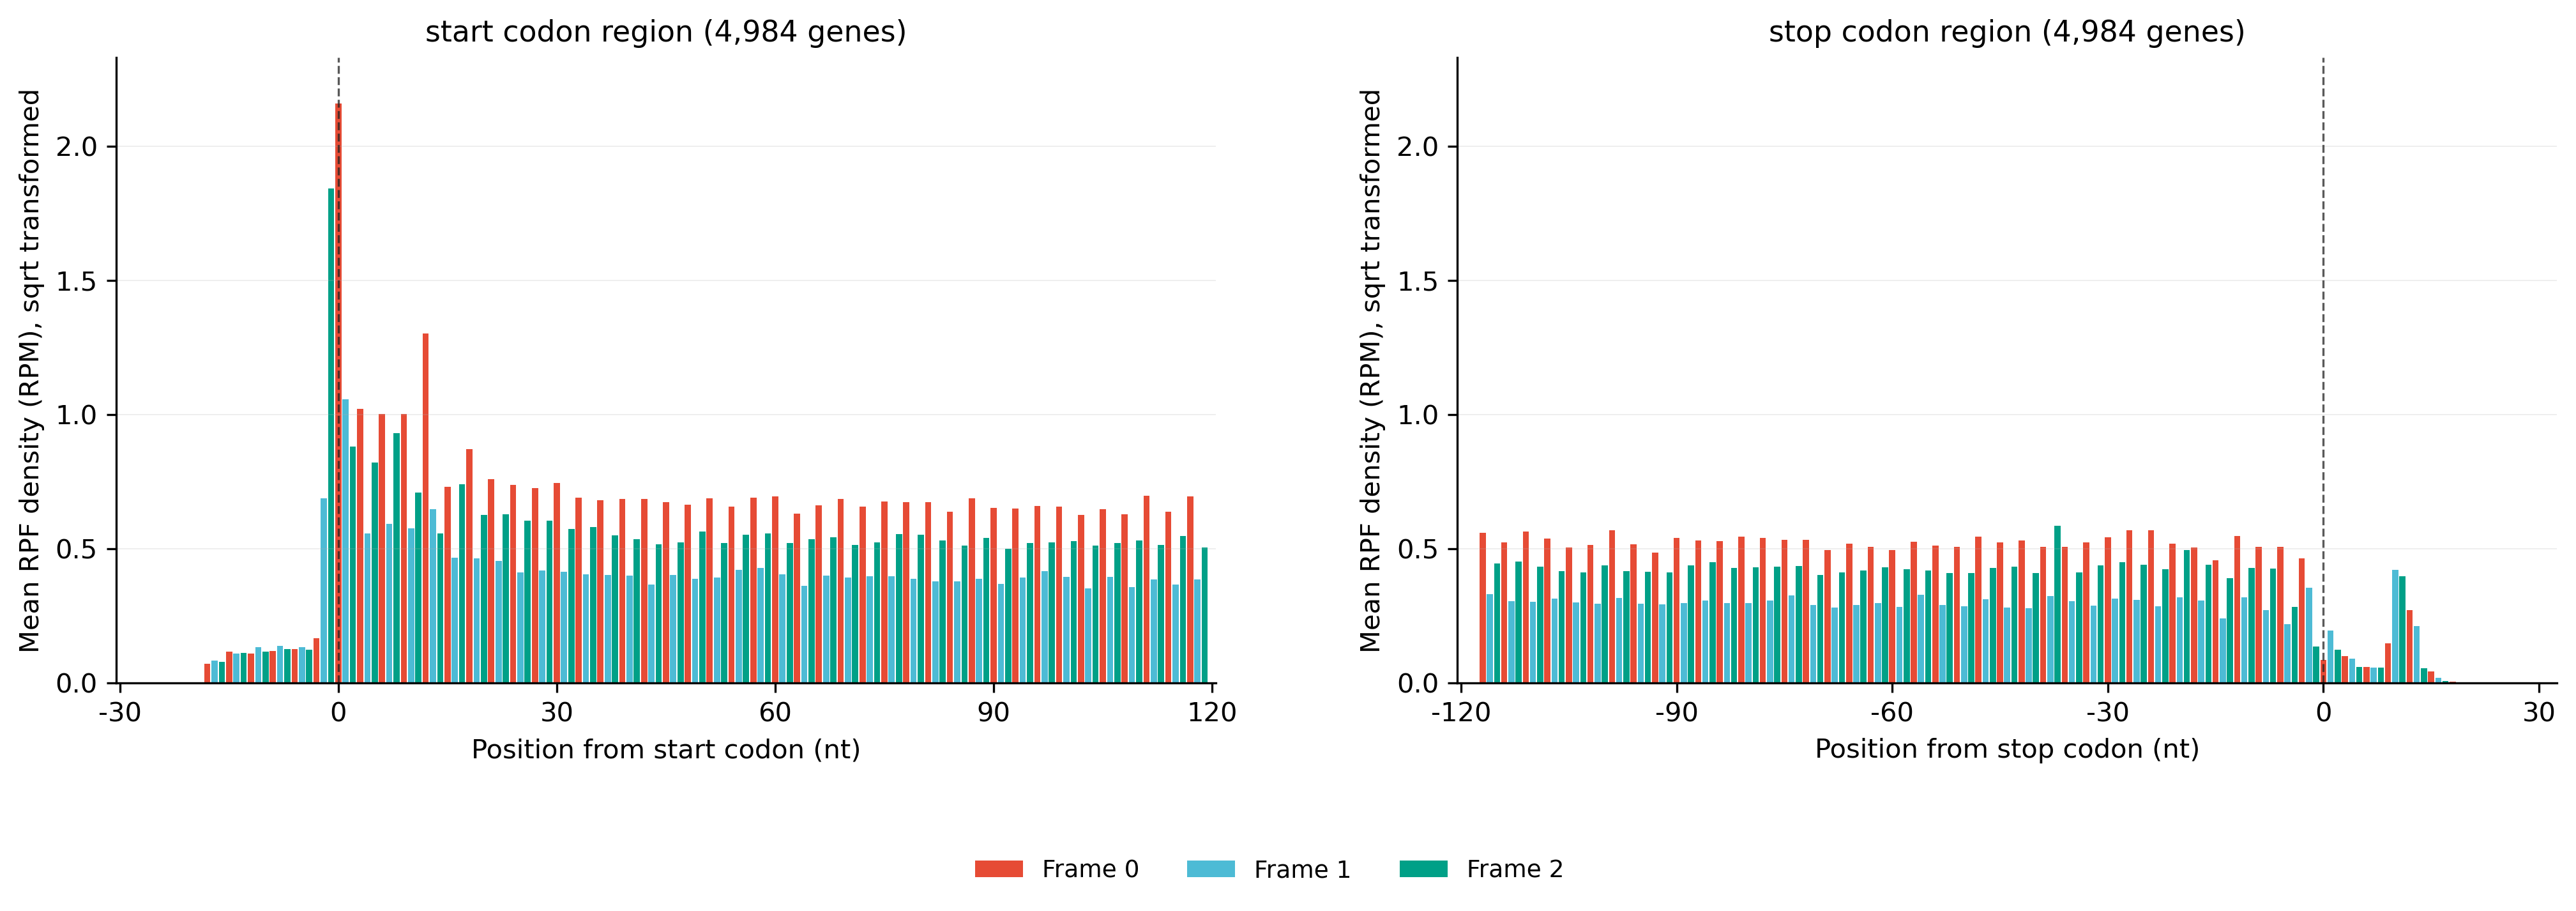
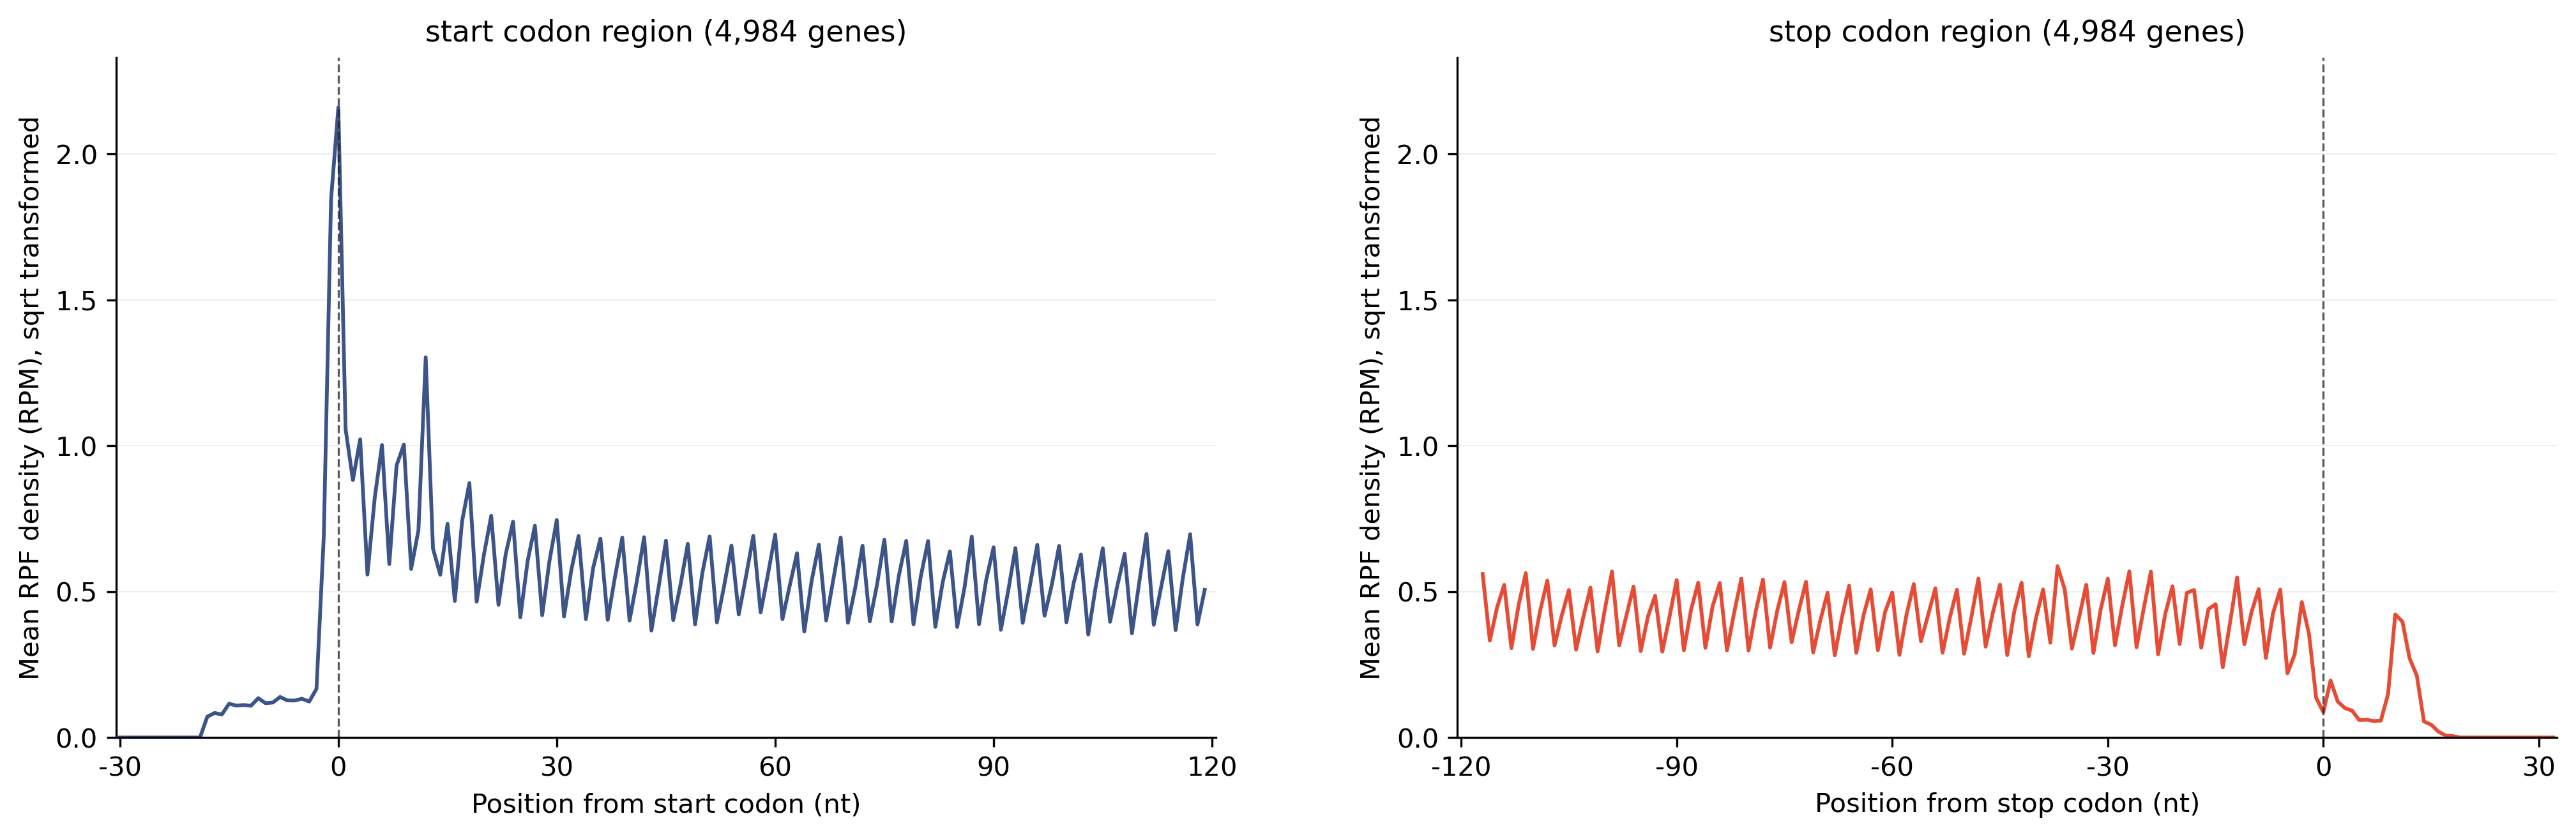
Both current JSONL density files and the legacy TXT density files are supported. The workflow aligns reads around start/stop codons, aggregates the density over a user-defined window (--utr5 / --cds / --utr3), and outputs per-sample bar or line figures together with a heatmap of all samples.
Step 1: Run rpf_Metaplot
Calculate metaplot profiles around TIS/TTS from a merged density file.
1.1 Parameters
| Parameter | Required | Description |
|---|---|---|
-r, --rpf |
Yes | Input RPF density file in JSONL or TXT format, usually the merged density file generated by rpf_Merge. |
-o, --output |
Yes | Output prefix. |
-t, --transcript |
No | Optional transcript filter table in TXT format. When provided, transcript_id is used if available. |
-m, --min |
No | Retain transcripts with at least this sample-specific CDS RPF count. Default is 50. |
--utr5 |
No | Number of codons upstream of the start codon. Default is 20. |
--cds |
No | Number of CDS codons used around start and stop codons. Default is 50. |
--utr3 |
No | Number of codons downstream of the stop codon. Default is 20. |
-n, --normal |
No | Normalize RPF counts to RPM before metaplot aggregation. Disabled by default. |
--mode |
No | Metaplot style for per-sample figures. Choices are line, bar, and both. Default is bar. |
--plot-transform |
No | Transform plotted density values without changing output tables. Choices are none, sqrt, log, log1p, log2, log10. log is an alias of log1p. Default is none. |
--scale |
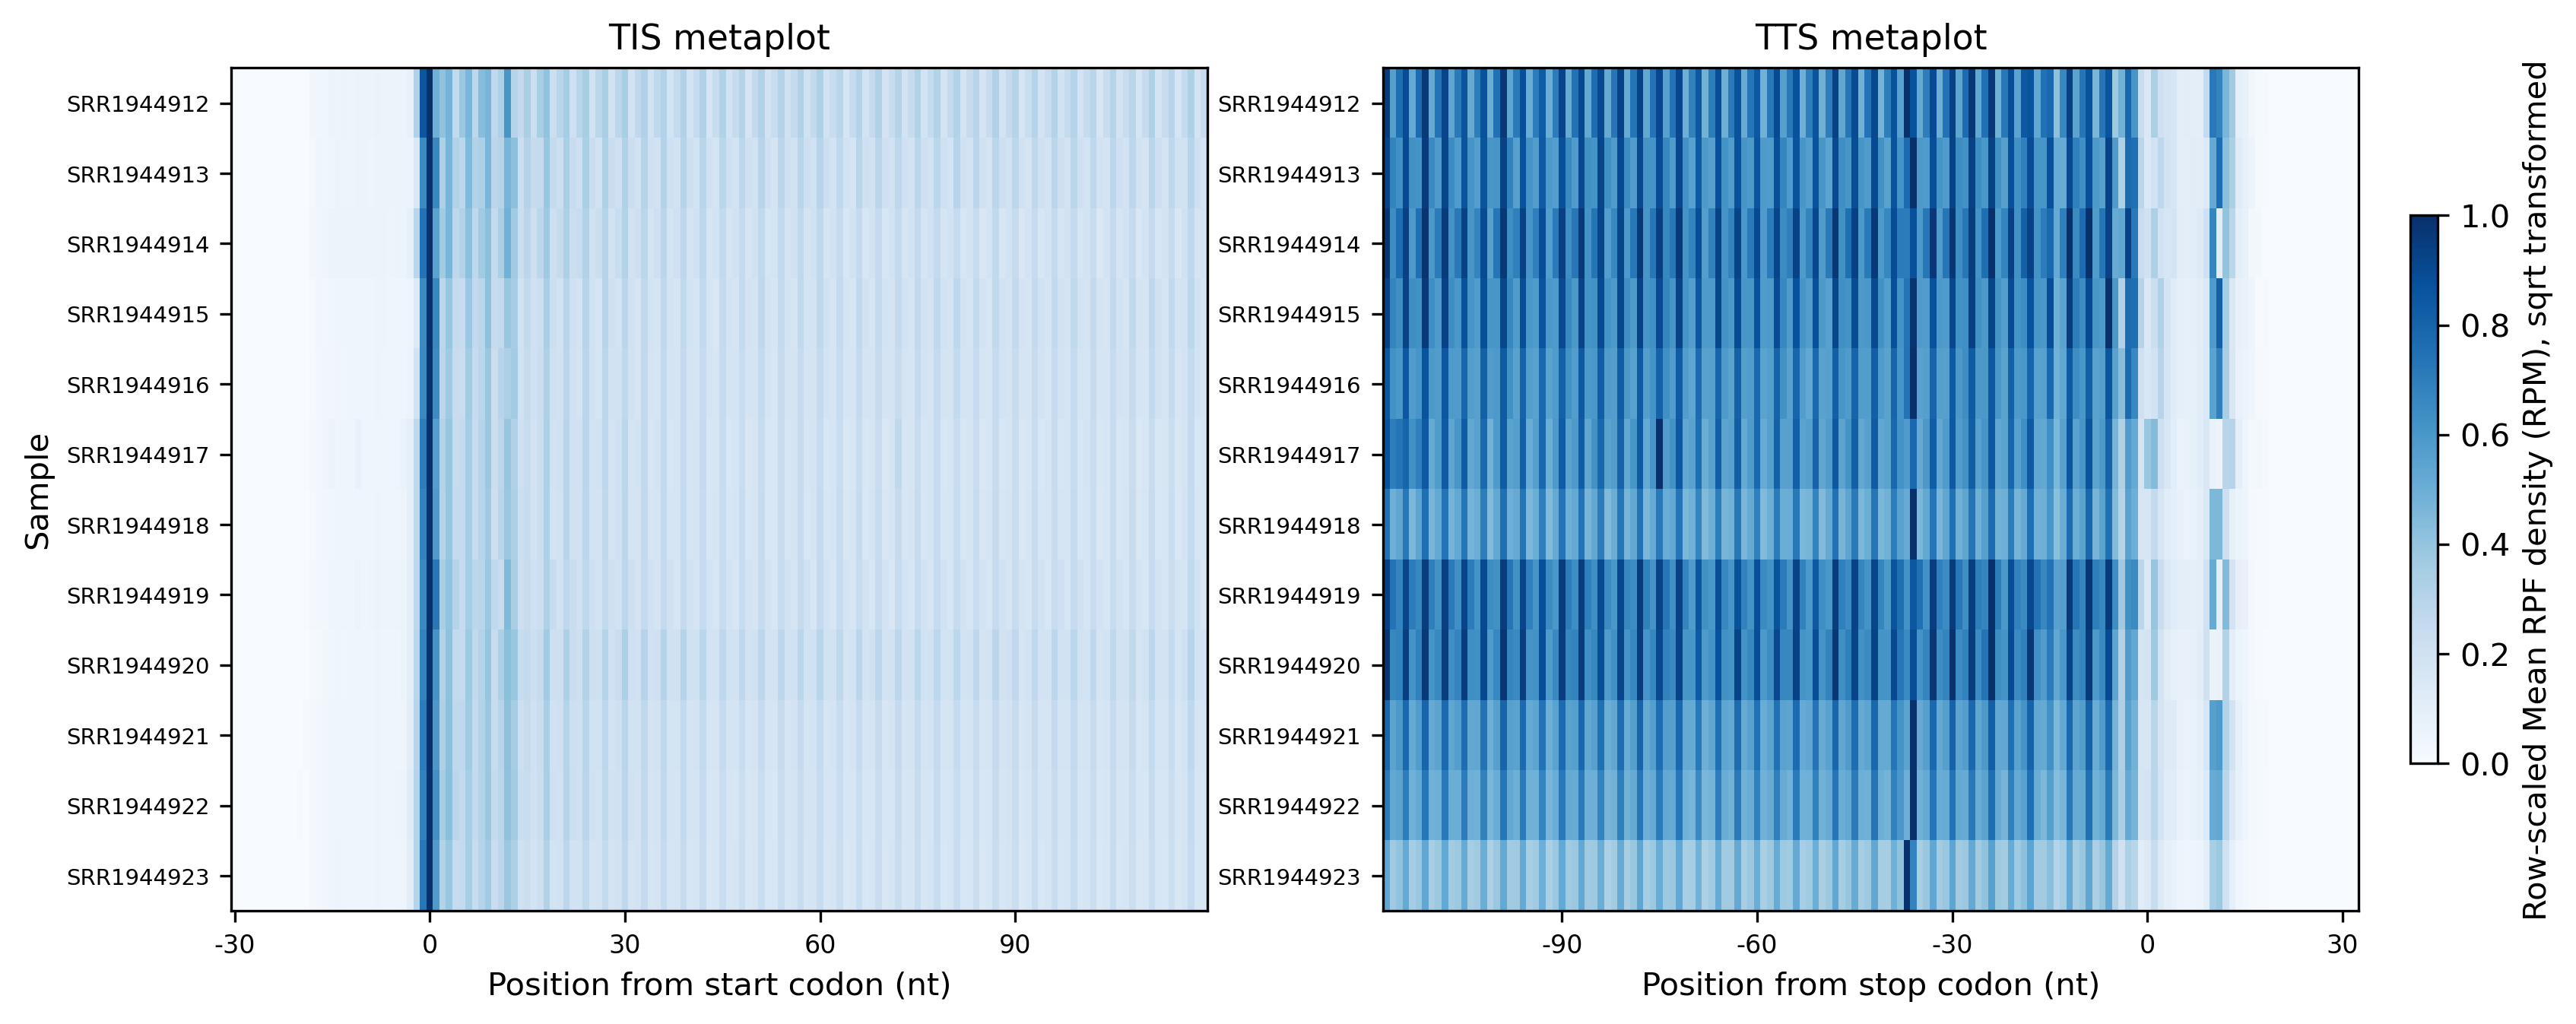
No | Heatmap scaling method. row applies row-wise min-max scaling to emphasize each sample profile shape. Choices are none and row. Default is none. |
--remove-outlier |
No | Remove extreme gene-position RPF pileups before aggregation. Useful for rRNA-like or mis-mapped fragments. Disabled by default. |
--outlier-iqr |
No | IQR multiplier for extreme pileup detection. Default is 8.0. |
--outlier-window |
No | Number of neighboring codons on each side used to estimate local background. Default is 5. |
--outlier-local-fold |
No | Minimum fold over local background for dynamic isolated-pileup filtering. Default is 10.0. |
1.2 Example
cd ./sce/4.ribo-seq/07.metaplot/

rpf_Metaplot \
    -t /path/to/norm/sce.genepred \
    -r ../05.merge/sce_rpf_merged.jsonl.gz \
    -n --scale row --remove-outlier --plot-transform sqrt \
    -m 50 --utr5 20 --cds 40 --utr3 20 --mode bar \
    -o sce \
    &> sce.log
1.3 Output
| Output | Description |
|---|---|
<prefix>_tis_tts_metaplot.txt |
Merged TIS/TTS metaplot table for all samples. |
<prefix>_metaplot.sample_summary.txt |
Per-sample summary of the metaplot aggregation. |
<prefix>_metaplot.outliers.txt |
Outlier table listing removed pileup points. Only written when --remove-outlier is enabled. |
<prefix>_{sample}_meta_{mode}_plot.pdf / .png |
Per-sample metaplot figure in the chosen mode (bar and/or line, one file per sample). |
<prefix>_metaplot_heatmap.pdf / .png |
Heatmap of all sample metaplot profiles. |
<prefix>_metaplot.summary.json |
Machine-readable summary of the run, including the output file list. |
Example output figures
Barplot of the TIS/TTS metaplot profile for a single sample (sce_SRR1944912_meta_bar_plot.png):
Lineplot of the TIS/TTS metaplot profile for a single sample (sce_SRR1944912_meta_line_plot.png):
Heatmap of the metaplot profiles for all samples (sce_metaplot_heatmap.png):
Step 2: Run merge_metagene
Merge metaplot tables from multiple samples or analyses into a single table.
2.1 Parameters
| Parameter | Required | Description |
|---|---|---|
-l, --list |
Yes | Input metagene files, e.g. *_tis_tts_metaplot.txt or *_metaplot.txt. Multiple files can be provided. |
-o, --output |
Yes | Output prefix. The merged table is written to <prefix>_metagene.txt. |
2.2 Example
2.3 Output
| Output | Description |
|---|---|
<prefix>_metagene.txt |
Merged metagene table, concatenated from all input files, with columns Sample, Meta, Nucleotide, Codon, Frame, Density. |
Notes
- Ribo-seq metaplots should show interpretable signal around TIS/TTS when offset correction is reliable.
- If no transcript covers the requested window, the window is automatically adjusted to the largest available one (the log reports the adjusted
--utr5/--cds/--utr3values). --plot-transformonly changes how density values are displayed in figures; it does not alter the output tables.- Strong boundary artifacts may indicate nuclease bias, offset problems, or transcript-end mapping artifacts.
- Use the same
-m,--utr5,--cds, and--utr3settings across samples when comparing metaplots.