4.5.1 Check
Purpose
rpf_Check inspects transcriptome-aligned BAM files, extracts reads mapped to transcript regions, generates filtered and indexed BAM files, summarizes read-length distribution, writes a machine-readable run summary, and optionally calculates read/gene saturation curves.
This is usually the first quality-control step after alignment. The quality-control workflow is divided into three steps:
Step 1: Run rpf_Check for each sample
Step 2: Merge read-length distributions
Step 3: Merge gene/read saturation
Input files
| Input | Description |
|---|---|
| BAM file | Transcriptome-aligned BAM file, such as Aligned.toTranscriptome.out.bam. |
| Transcript annotation | Normalized transcript annotation file, usually gene.norm.txt generated by rpf_Reference. |
| Output prefix | Sample-specific prefix used for filtered BAM, tables, figures, and logs. |
Step 1: Run rpf_Check
1.1 Parameters
| Parameter | Required | Description |
|---|---|---|
-t |
Yes | Input gene/transcript annotation file generated by rpf_Reference, usually gene.norm.txt. |
-b |
Yes | Input BAM/SAM alignment file. |
-o |
Yes | Output prefix. |
--thread |
No | Number of threads. Default is 4. When greater than 1, an indexed BAM is prepared and the transcript reference is fetched by multiple processes. |
-g |
No | Filter reads by mapping uniqueness. Use 0 to keep all mapped reads or 1 to keep uniquely mapped reads only. Default is 0. |
-a |
No | Aligner used to generate the BAM/SAM file, controlling unique-read tag interpretation. Choices are star, hisat2, and bowtie2. Default is star. |
-r |
No | Backward-compatible option retained for old commands. The current rpf_Check always retains and reports plus/minus strands separately. |
--secondary |
No | Keep secondary alignments. Disabled by default. |
--supplementary |
No | Keep supplementary alignments. Disabled by default. |
--duplicate |
No | Keep duplicate alignments. Disabled by default. |
-l |
No | Keep only the representative/longest transcript for each gene. Disabled by default. |
-s |
No | Calculate RPF saturation (gene-level and read-level curves). Takes extra memory, especially when multi-mapping reads are retained. Disabled by default. |
1.2 Example
cd ./sce/4.ribo-seq/01.qc/

for bam in ../../3.star/*Aligned.toTranscriptome.out.bam
do
    prefix_name=$(basename ${bam} Aligned.toTranscriptome.out.bam)

    rpf_Check \
        -b ${bam} \
        -t ../../../1.reference/norm/gene.norm.txt \
        -o ${prefix_name} \
        -g 1 \
        -a star \
        --thread 10 \
        -s \
        &> ${prefix_name}.log
done
1.3 Output
| Output | Description |
|---|---|
<prefix>.bam |
Filtered and sorted BAM file. |
<prefix>.bam.bai |
BAM index file. |
<prefix>_rpf_check.summary.json |
Machine-readable run summary (JSON format). |
<prefix>_length_distribution.txt |
Read-length distribution table. |
<prefix>_length_distribution.pdf / <prefix>_length_distribution.png |
Read-length distribution plots. |
<prefix>_gene_saturation.txt |
Gene saturation table, generated when -s is used. |
<prefix>_gene_saturation.pdf / <prefix>_gene_saturation.png |
Gene saturation plots, generated when -s is used. |
<prefix>_reads_saturation.txt |
Read saturation table, generated when -s is used. |
<prefix>_reads_saturation.pdf / <prefix>_reads_saturation.png |
Read saturation plots, generated when -s is used. |
<prefix>.log |
Running log if redirected by the user. |
Example output figures
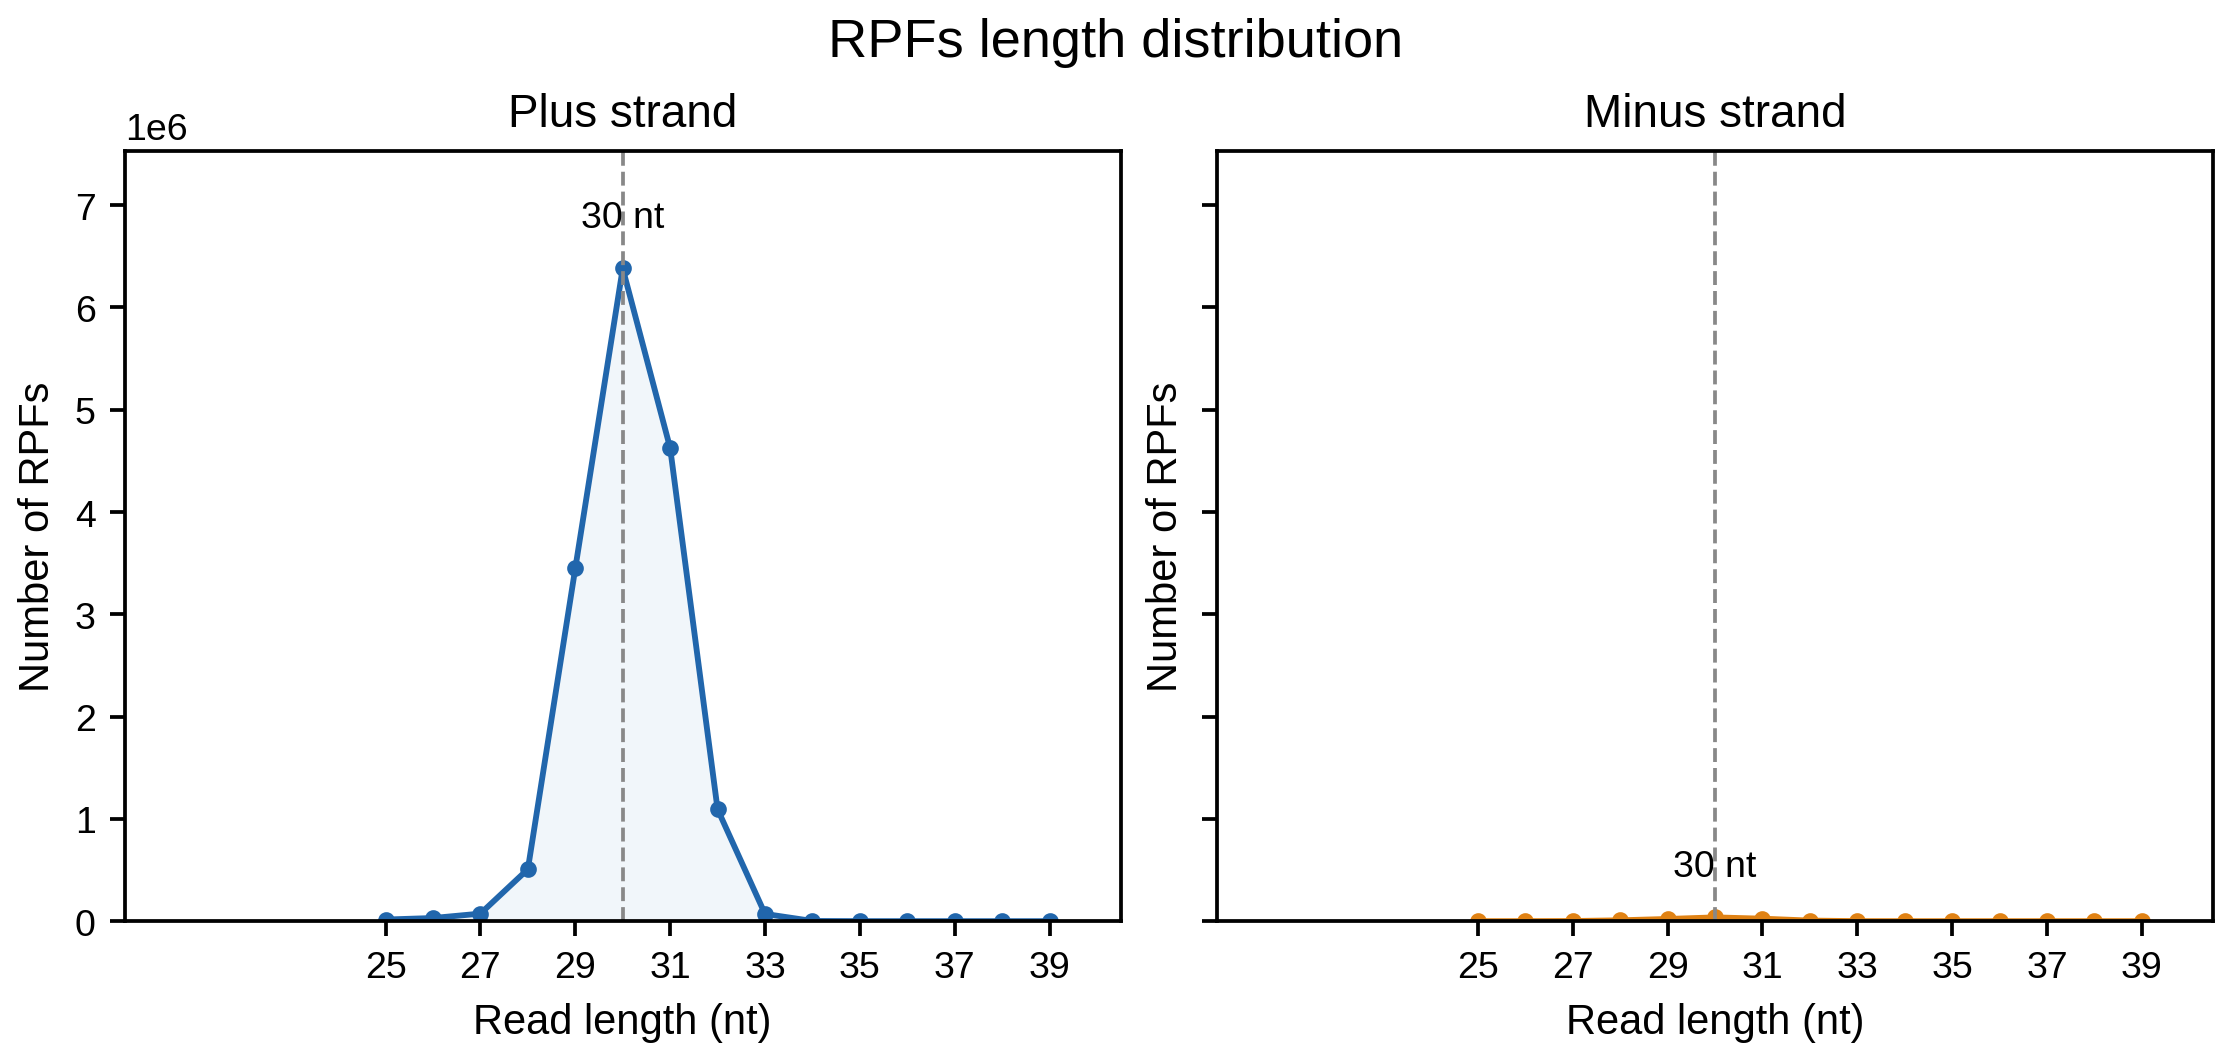
The read-length distribution plot shows the footprint-length profile and the dominant RPF length of the sample:
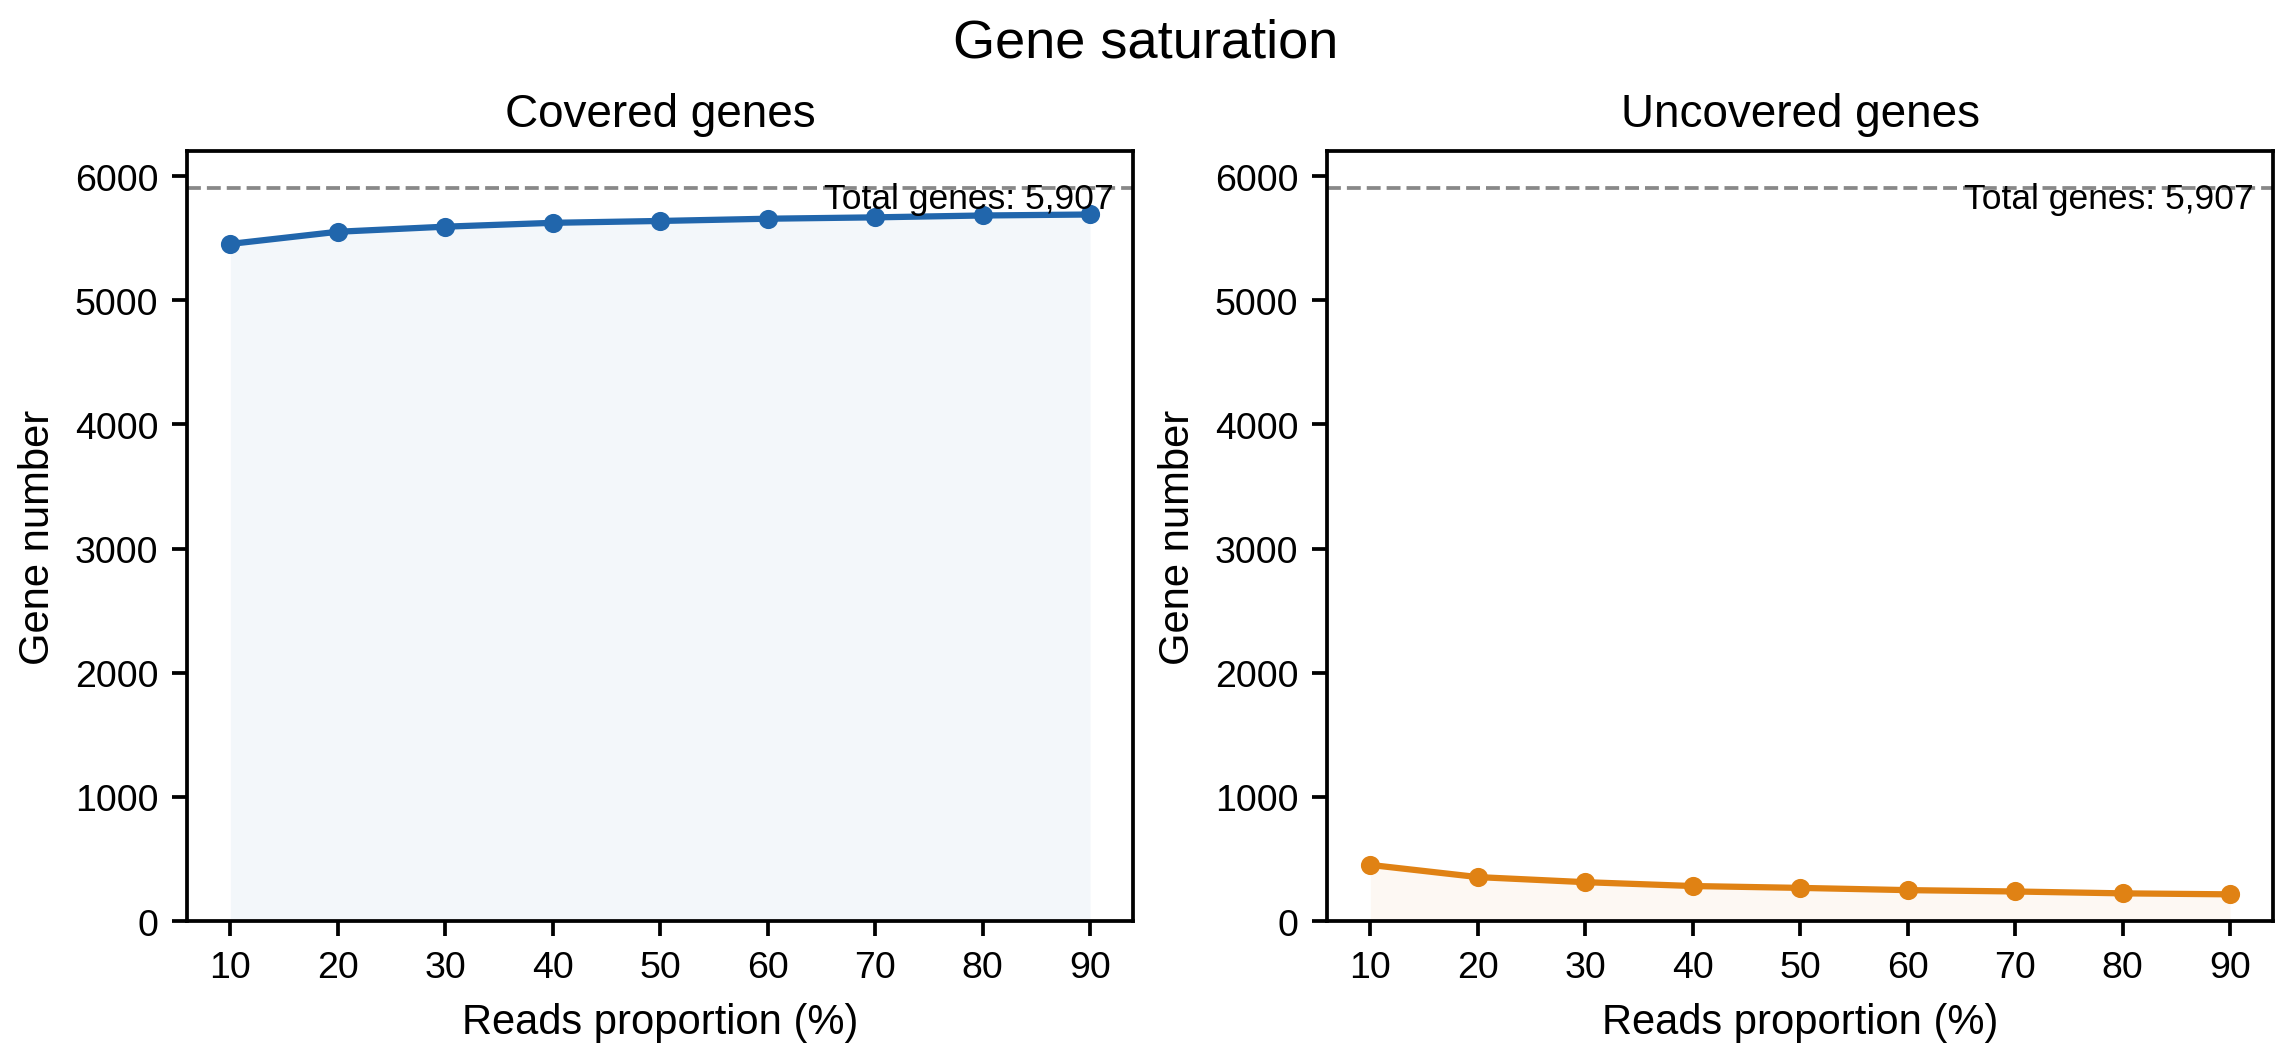
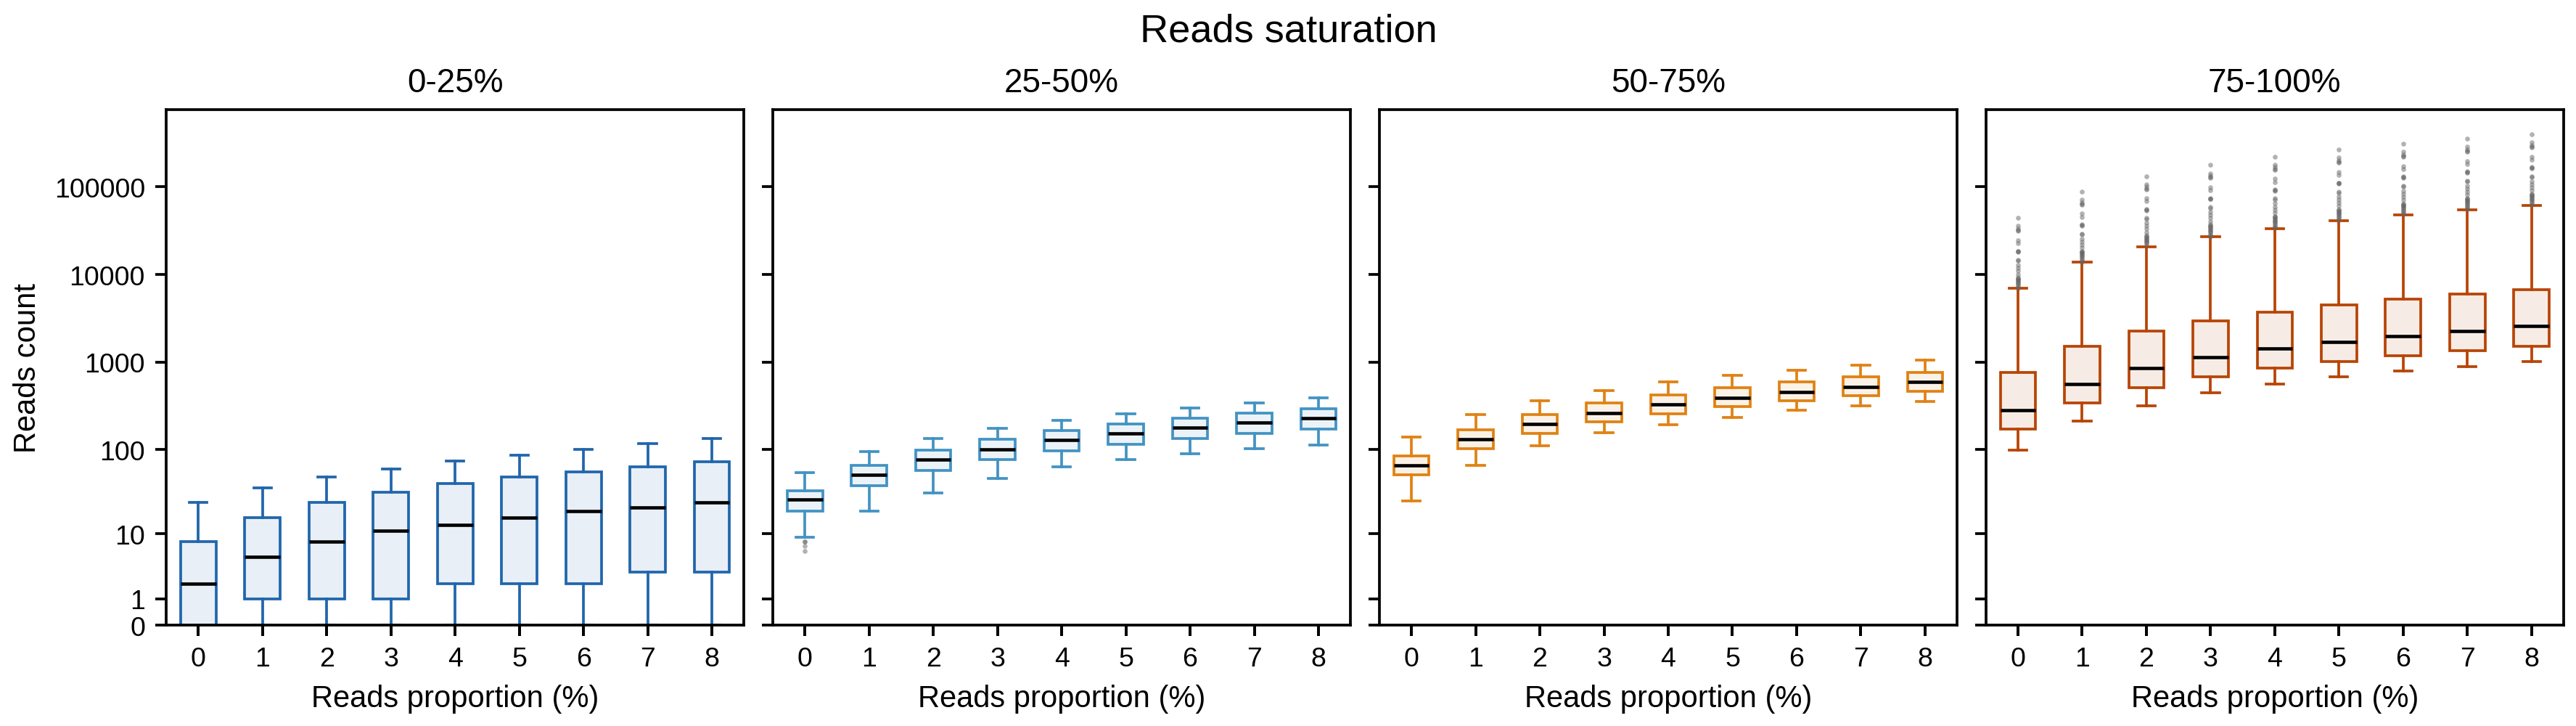
The gene and read saturation curves evaluate whether sequencing depth is sufficient, generated when -s is used:
Step 2: Merge read-length distributions
merge_length merges the read-length distribution tables from multiple samples into a single table.
2.1 Parameters
| Parameter | Required | Description |
|---|---|---|
-l / --list |
Yes | Input *_length_distribution.txt files. Multiple files can be provided. |
-o |
Yes | Output prefix. The output table is <prefix>_length_distribution.txt. |
2.2 Example
2.3 Output
| File | Description |
|---|---|
RIBO_length_distribution.txt |
Merged read-length distribution table. |
RIBO_length_distribution_dotline.png / RIBO_length_distribution_dotline.pdf |
Dot-line plot of read-length distribution across samples. |
RIBO_length_distribution_heatmap.png / RIBO_length_distribution_heatmap.pdf |
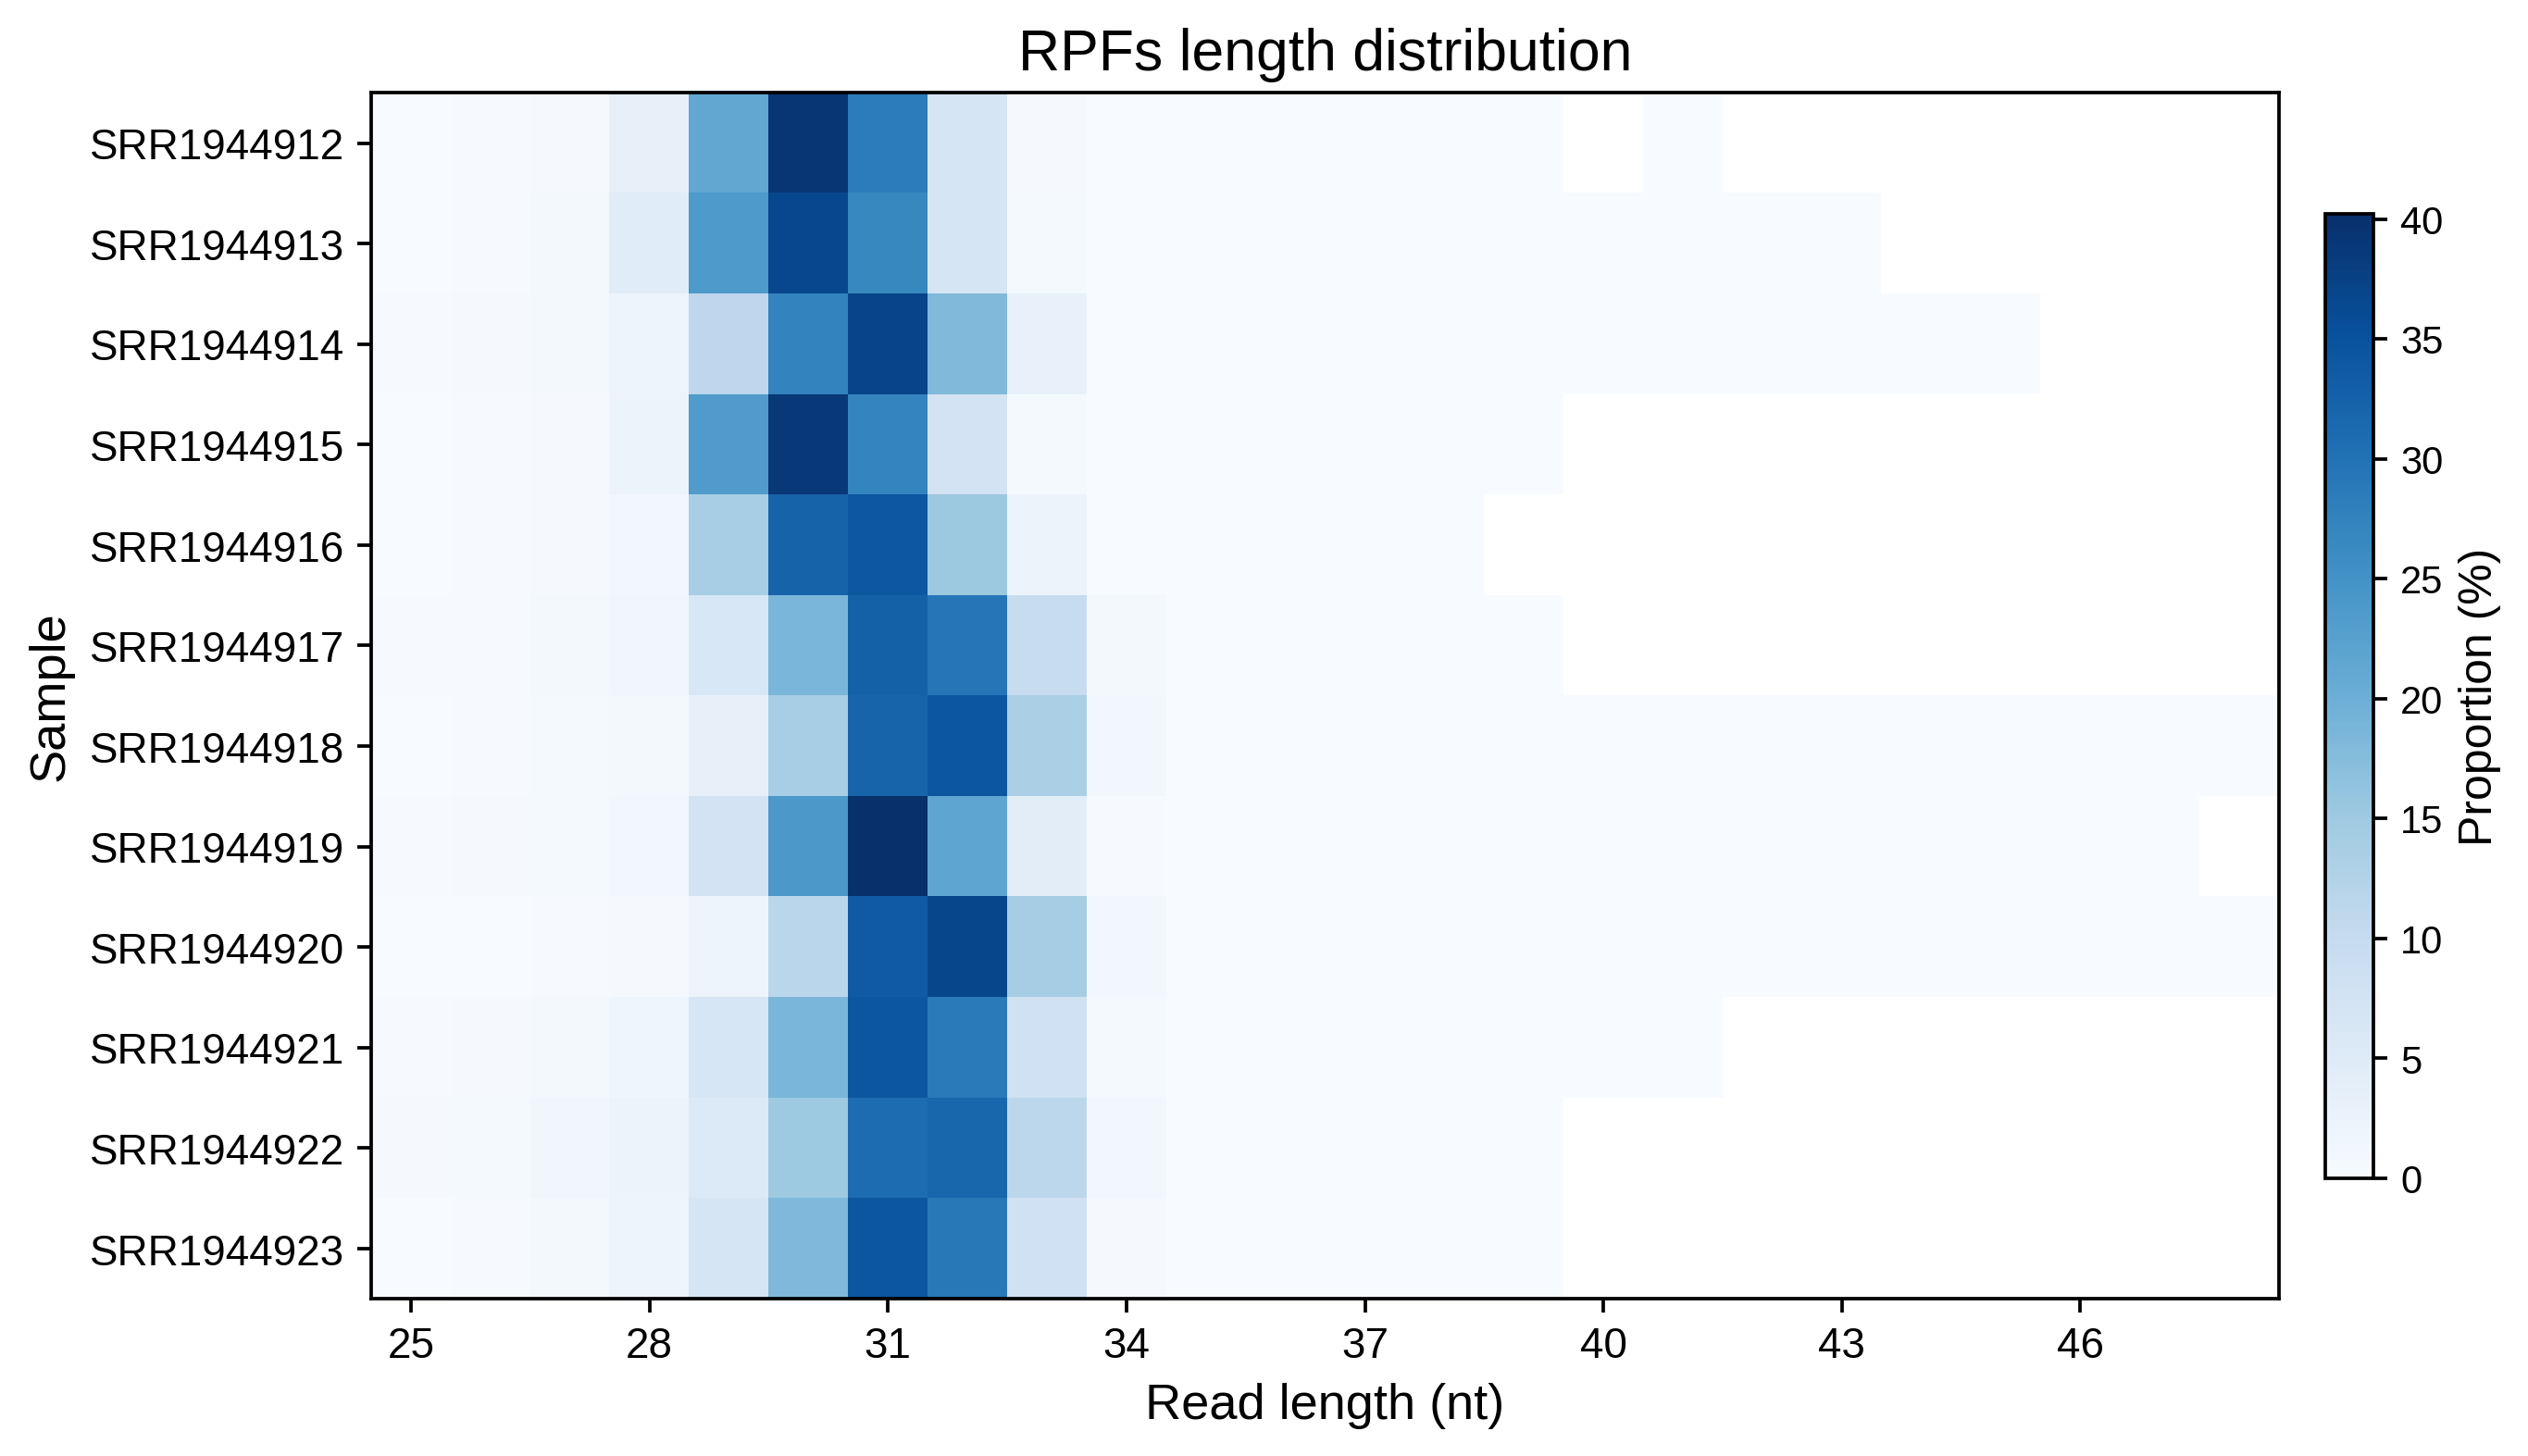
Heatmap of read-length distribution across samples. |
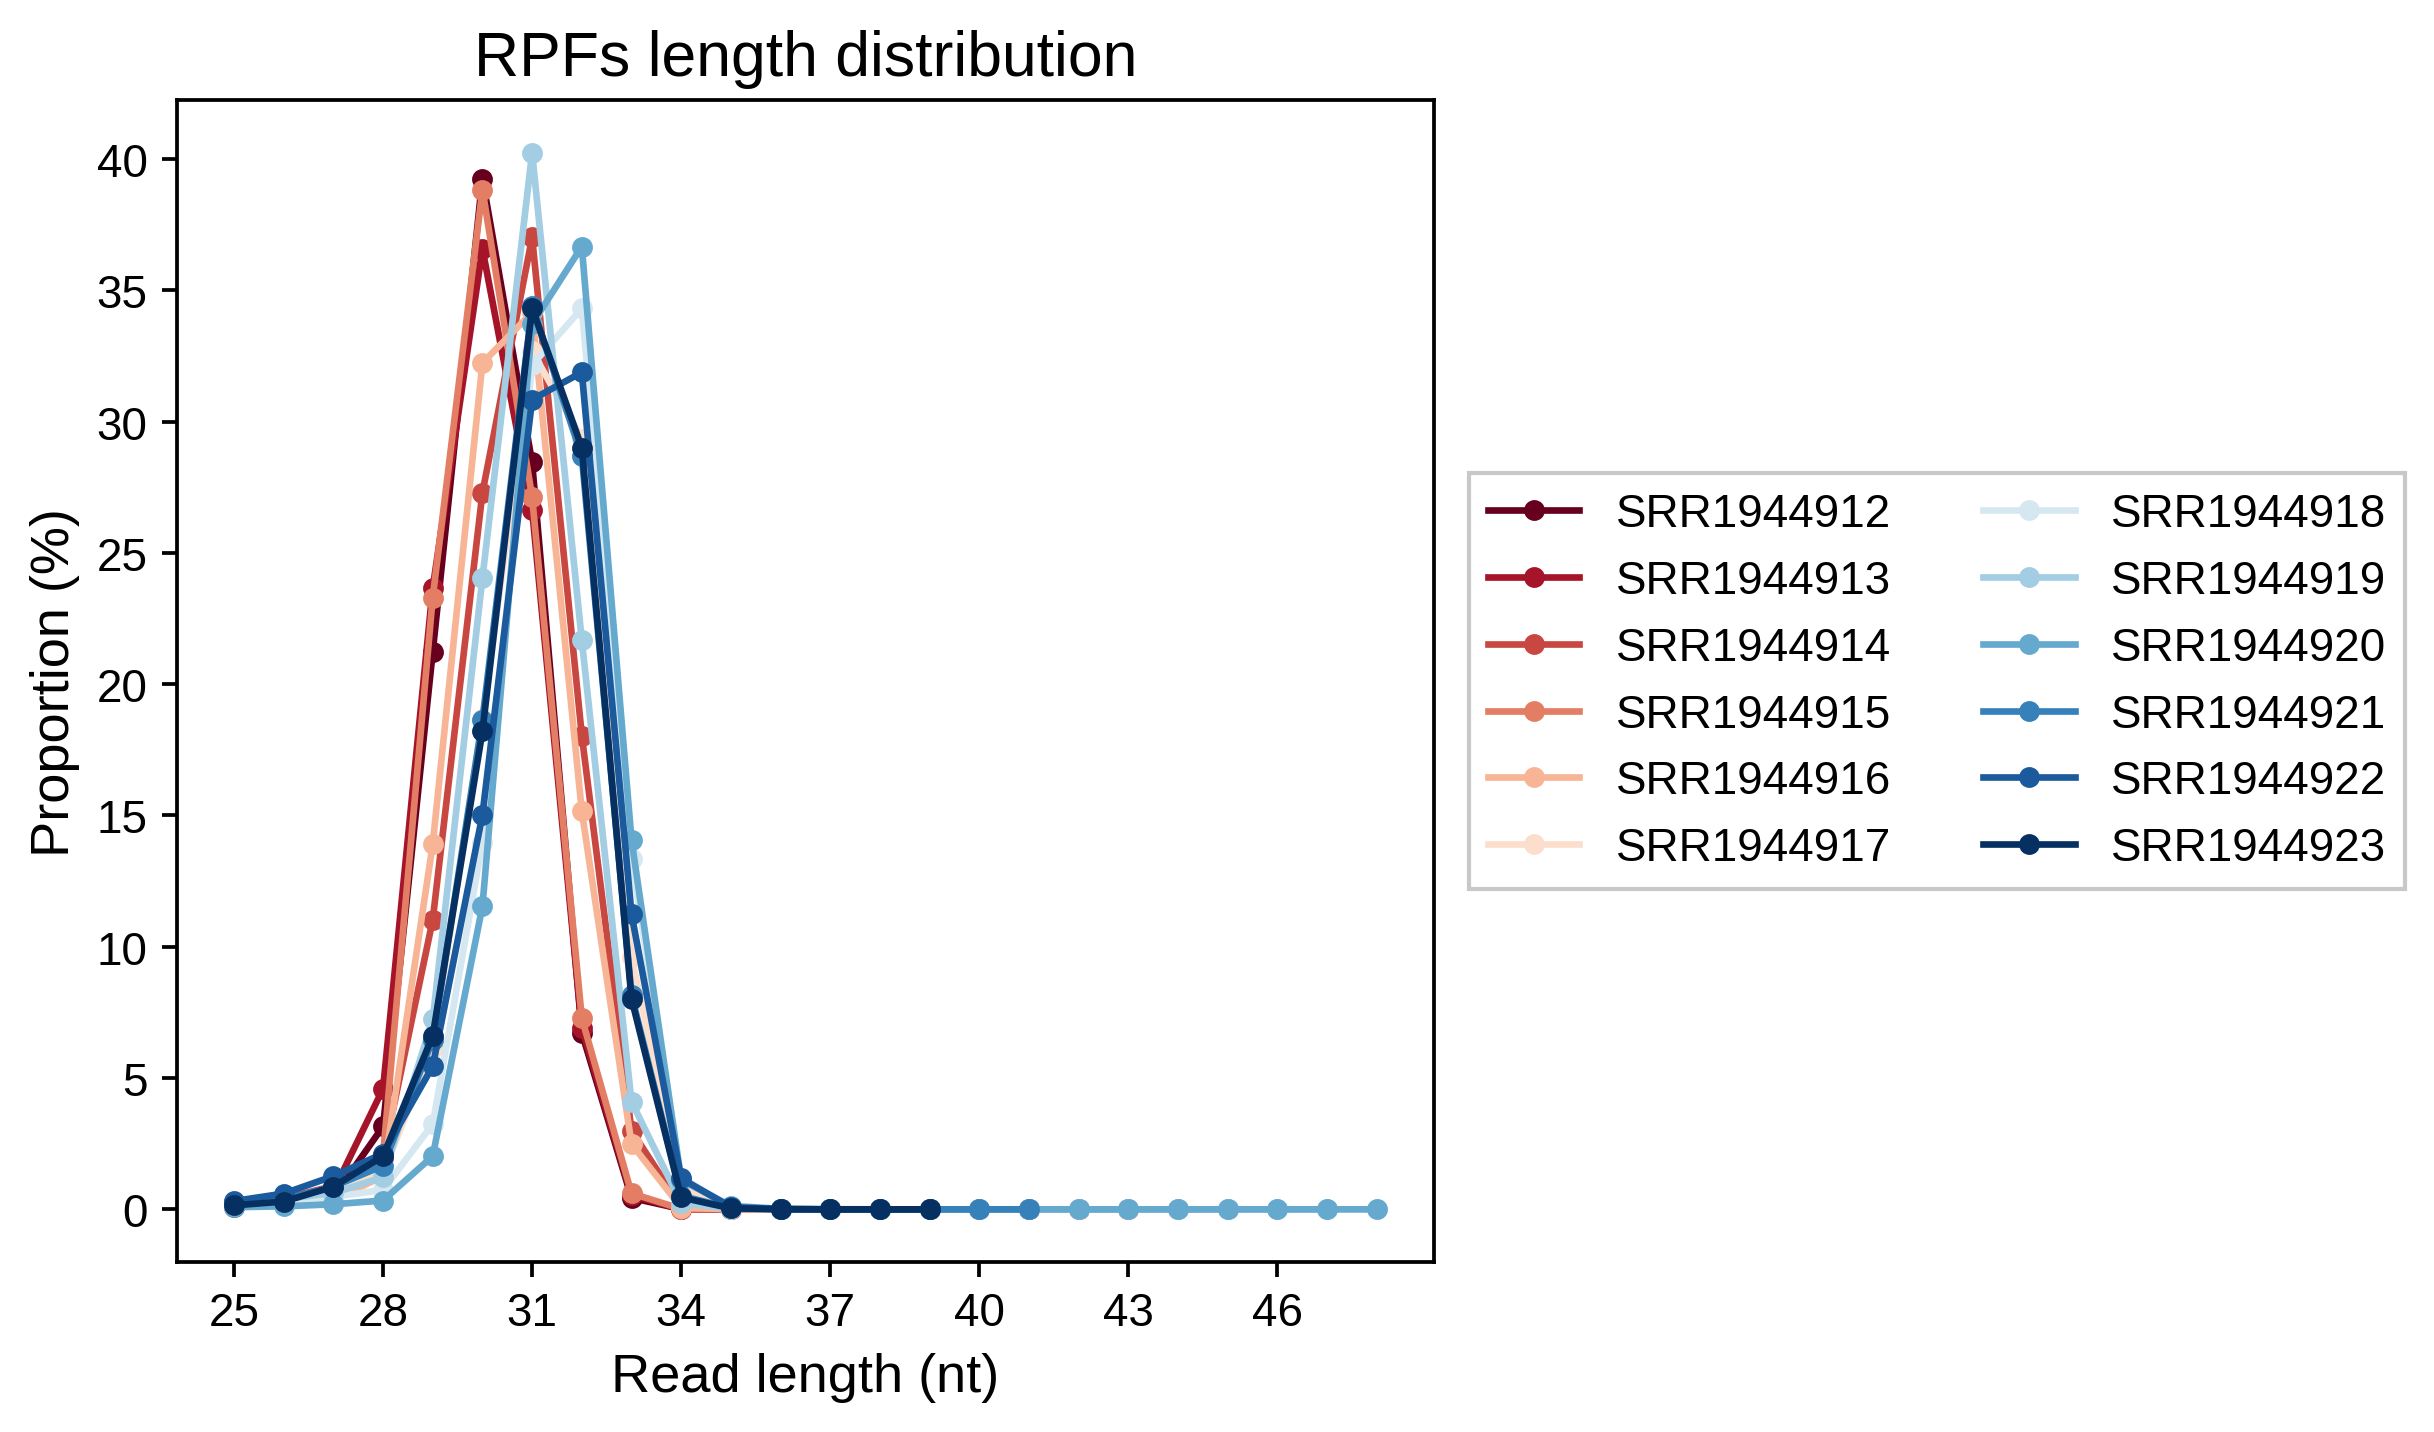
The dot-line plot and heatmap visualize the read-length profiles of all samples in a single figure:
Step 3: Merge gene/read saturation
merge_saturation merges the gene saturation files from multiple samples into a single table.
3.1 Parameters
| Parameter | Required | Description |
|---|---|---|
-l / --list |
Yes | Input saturation files, usually *_gene_saturation.txt. Multiple files can be provided. |
-o |
Yes | Output prefix. The output table is <prefix>_gene_saturation.txt. |
3.2 Example
3.3 Output
| File | Description |
|---|---|
RIBO_gene_saturation.txt |
Merged gene saturation table. |
RIBO_gene_saturation_dotline.png / RIBO_gene_saturation_dotline.pdf |
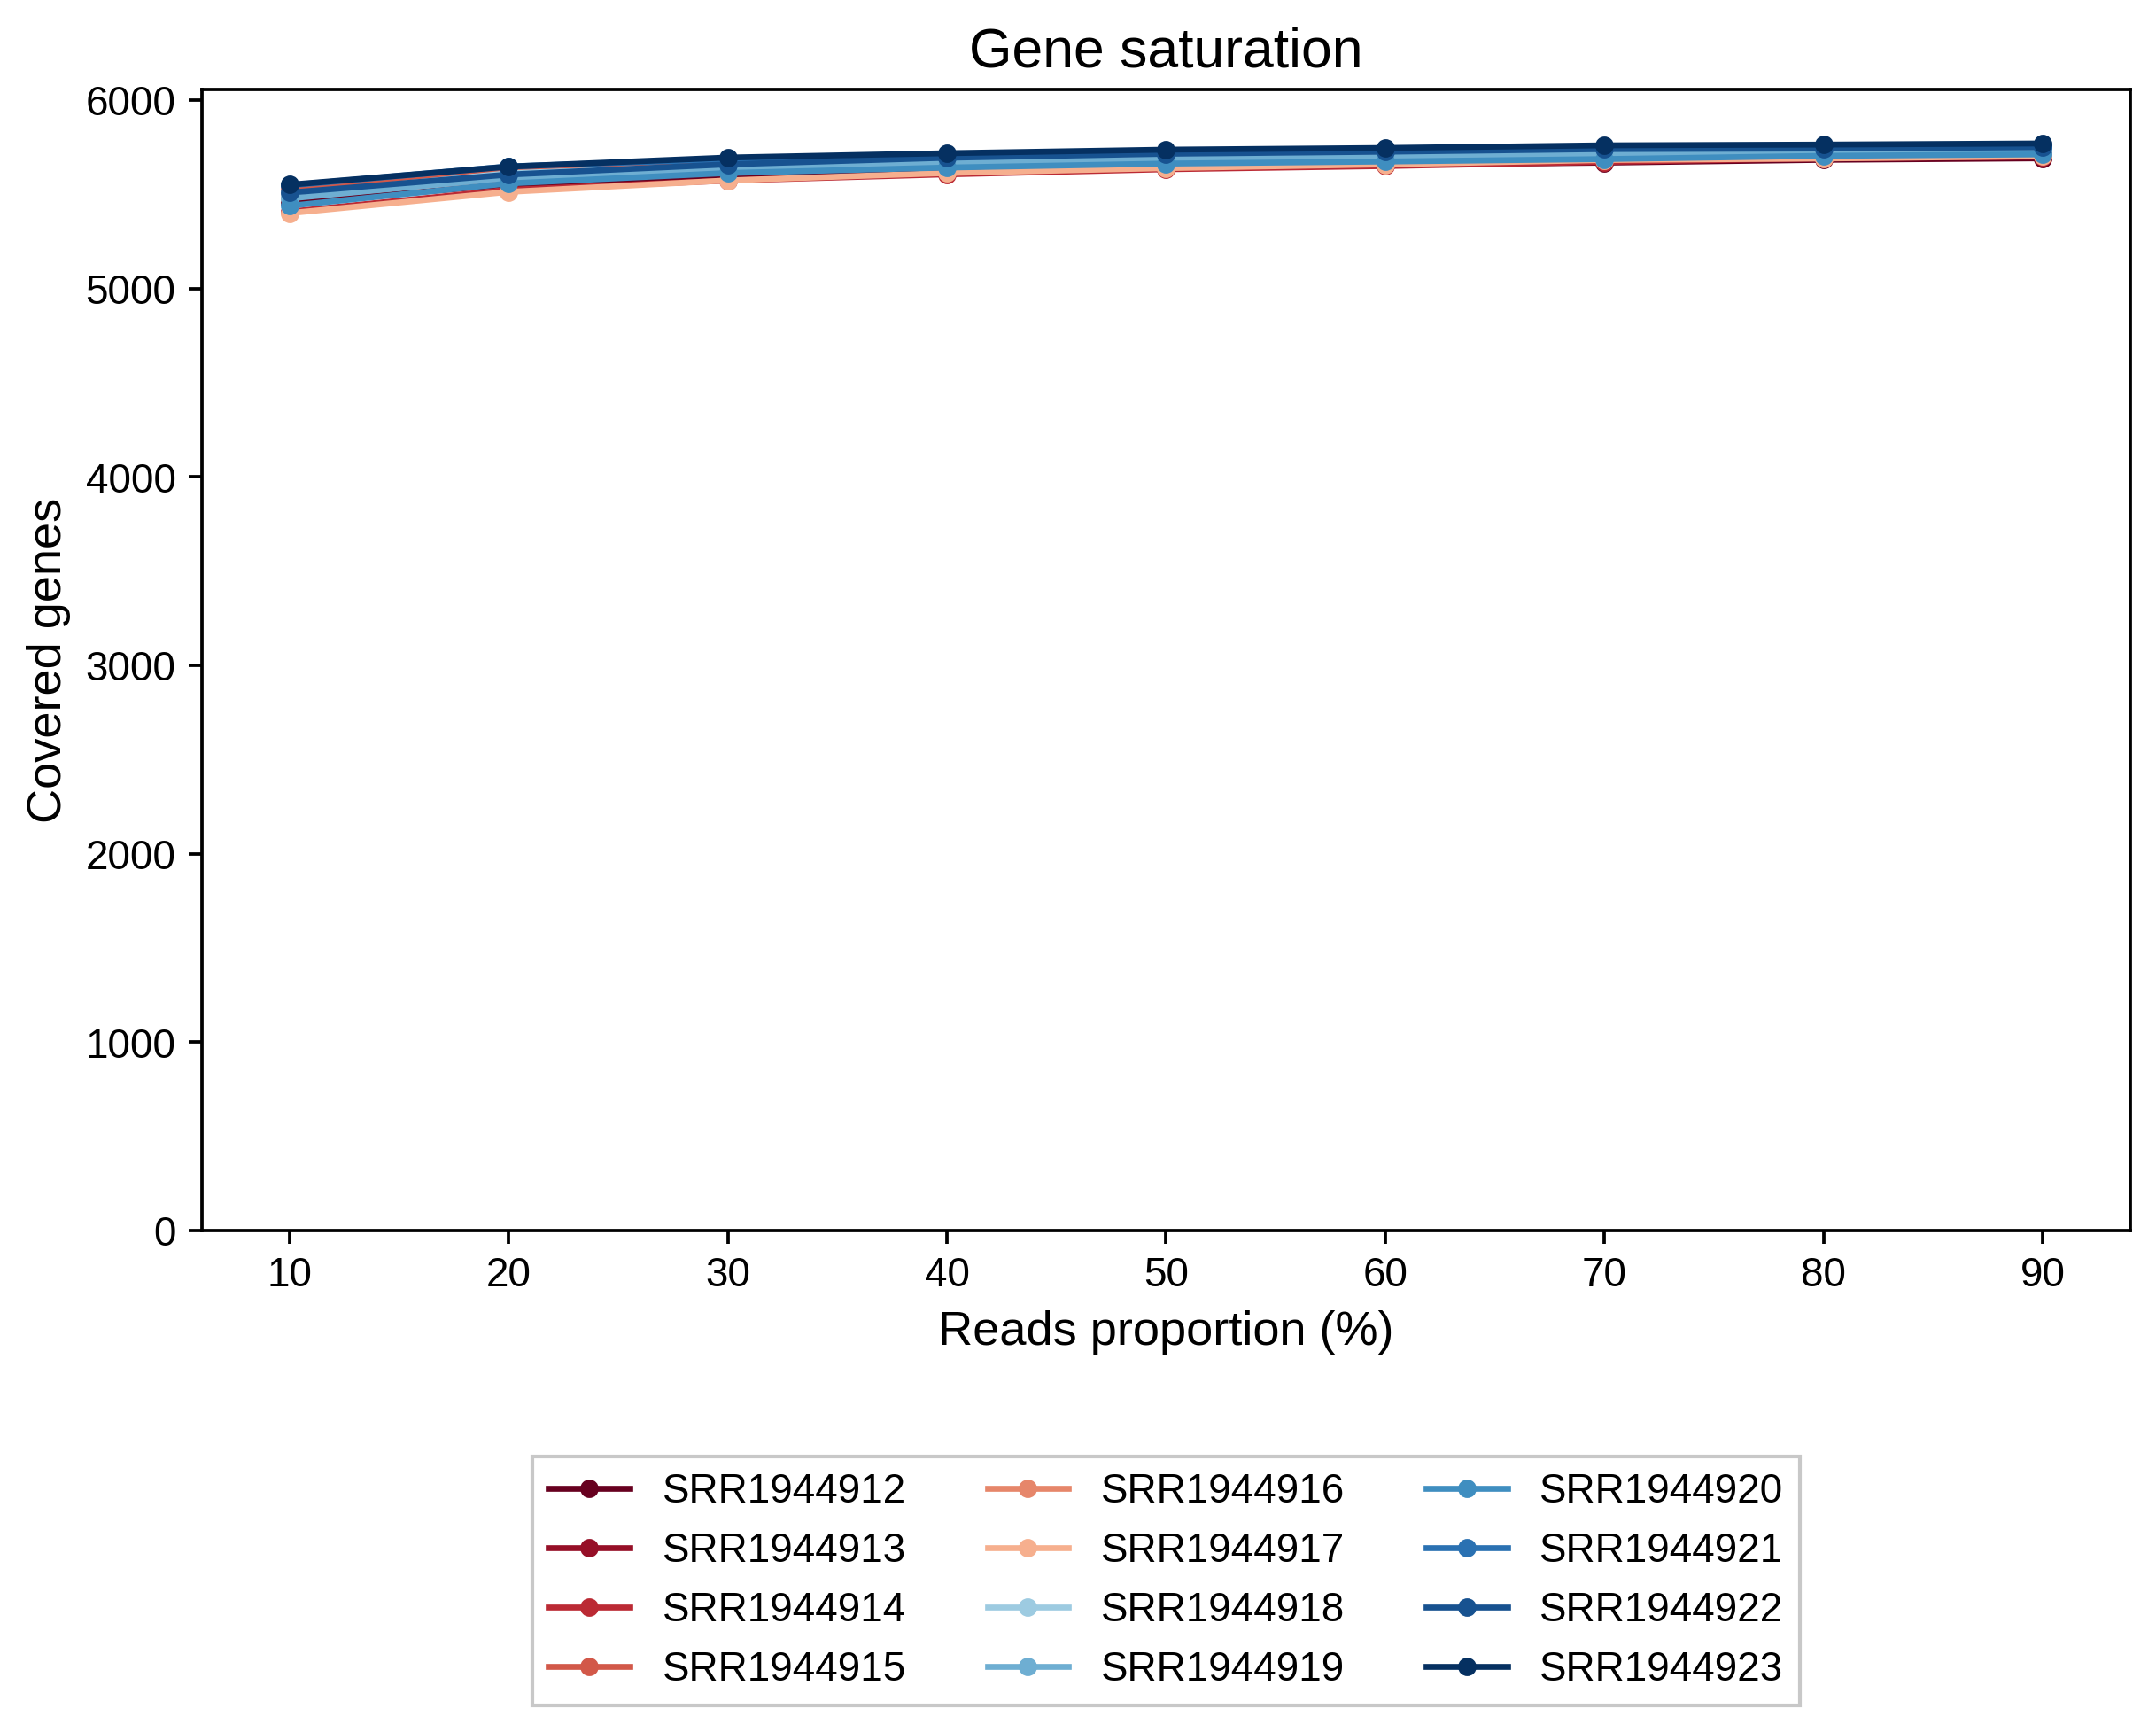
Dot-line plot of gene saturation across samples. |
The dot-line plot shows the gene saturation trend of all samples:
Notes
- Ribo-seq libraries should show a dominant footprint length, commonly within a narrow RPF length range.
- Use
-swhen you need to evaluate whether sequencing depth is sufficient; skip it for a fast initial check. - Use
-g 1when downstream analysis should be based on uniquely mapped reads only. - Secondary, supplementary, and duplicate alignments are removed by default; use
--secondary,--supplementary, or--duplicateto keep them.