4.7.7 Meta-codon analysis
Purpose
rpf_Meta_Codon extracts the average RPF density around selected codons or codon motifs (for example AAA, or a multi-codon motif such as GCTGAA) across the CDS, and aggregates the same-position sites of all retained transcripts into one meta profile per sample. It supports single codons as well as multi-codon motifs whose length is a multiple of three.
Key features:
- Streaming input – reads the same compact RPF density file (JSONL / JSONL.GZ, for example
sce_rpf_merged.jsonl.gz) used by the otherrpf_*tools, so no separate TXT table has to be exported. - A-site resolved – density is internally shifted to the A-site before aggregation.
- Frame- and expression-controlled – the reading frame can be restricted with
-f, and only transcripts whose mean CDS RPF count reaches-mare retained, which suppresses background from lowly expressed genes. - Nucleotide-level meta profiles – with
--unit nucleotidethe meta profile is expanded to one value per nt while keeping the three frames (f0/f1/f2) separate, so the tri-nucleotide periodicity remains visible in the density table and in the figure. - Flexible normalization – optional RPM normalization (
-n) and scaling by the gene-level mean density (-s), which is useful when comparing samples of different depths. - Unique-site option –
-ukeeps only sites where the target motif occurs once within the retrieval window, reducing inflation of the local background by repeated motifs.
The analysis is performed in seven steps:
- Check the input arguments – validate the input files and parameter combinations.
- Import the codon list – read the target codons/motifs; RNA
Uis converted to DNAT. - Import the RPF density file – stream the density file, keep only the retained transcripts, and apply the optional frame filter, RPM normalization, and gene-mean scaling.
- Smooth the RPF density profiles – apply the optional Savitzky-Golay smoothing (
--smooth). - Retrieve meta-codon density profiles – collect the sites of each target motif and average the same-position density across all retained transcripts.
- Output meta-codon results – write one density table and one sequence-context table per target motif.
- Draw meta-codon figures – generate the line plots (only with
--fig).
Step 1: Run rpf_Meta_Codon
The RPF density input is the same compact file as in the other rpf_* analyses (see 4.5.5 Merge density). If a TXT density table must be used, the shared reader also accepts it.
1.1 Parameters
| Parameter | Required | Description |
|---|---|---|
-r, --rpf |
Yes | Input frame-resolved RPF density file (JSONL, JSONL.GZ, or TXT). |
-o, --output |
Yes | Output file prefix. |
-l, --list |
No | Optional transcript ID list; only these transcripts are analyzed. |
-c, --codon |
No | Optional codon or codon-motif list (one per line). If omitted, all codons of the codon table are used. RNA U is converted to DNA T. |
-f, --frame |
No | Reading frame used for the analysis. Choices 0, 1, 2, all. Default all. |
-a, --around |
No | Number of codons retained upstream and downstream of the target motif. Default 10. |
-m, --min |
No | Minimum RPF count required for retained transcripts. Default 50. |
--tis |
No | Number of codons removed after the translation initiation site. Default 0. |
--tts |
No | Number of codons removed before the translation termination site. Default 0. |
-u, --unique |
No | Only retain sites where the target motif occurs once within the retrieval window. Disabled by default. |
-n, --normal |
No | Normalize RPF counts to RPM before aggregating. Disabled by default. |
-s, --scale |
No | Scale the meta-codon density by the gene-level density. Disabled by default. |
--smooth |
No | Optional Savitzky-Golay smoothing of the density profiles. Disabled by default. |
--unit |
No | X-axis position unit. Choices codon, nucleotide. Default codon. With nucleotide, one value per nt is produced while the frames are kept separate, so the tri-nucleotide periodicity remains visible. |
--fig |
No | Draw the meta-codon line plots. Disabled by default. |
--ylim-scale |
No | Compression factor for the y-axis upper limit of the plots. The limit is the data maximum times this factor, rounded up to a clean tick value, flattening the vertical range while staying data-driven. Default 1.5. |
--thread |
No | Number of worker processes. Default 1. |
1.2 Example
cd ./sce/4.ribo-seq/17.meta_codon/

rpf_Meta_Codon \
    -r ../05.merge/sce_rpf_merged.jsonl.gz \
    -o sce \
    -c codon.list \
    --unit nucleotide \
    --thread 10 \
    -u -n -s --fig \
    &> sce_meta_codon.log
In this example, three codons are read from codon.list (AAA, CAA, GAA), the density is imported from the compact JSONL file, RPM-normalized (-n) and gene-mean scaled (-s), repeated motifs within a window are removed (-u), and nucleotide-level meta profiles are drawn (--unit nucleotide --fig) with 10 worker processes.
1.3 Output
All output files are written to the current working directory with the given prefix:
| Output | Description |
|---|---|
<prefix>_<codon>_<raw_sites>_<retained_sites>_meta_density.txt |
Meta-density table of the target motif (see below). |
<prefix>_<codon>_<raw_sites>_<retained_sites>_meta_sequence.txt |
Sequence-context table of the target motif (see below). |
<prefix>_<codon>.pdf / .png |
Meta-codon line plot (only with --fig). |
The file names record the total number of matched sites (raw_sites) and the number of sites retained after filtering (retained_sites).
Density table <prefix>_<codon>_..._meta_density.txt – one row per relative position, one column per sample:
Codon– relative codon position of the window (e.g.-30...+30).Nucleotide– relative nucleotide position (present when--unit nucleotide).Frame– reading frame of the position (0/1/2); with--unit nucleotidethe frames are kept separate so that the tri-nucleotide periodicity is retained.- Remaining columns – the mean density of each sample at that relative position.
Sequence-context table <prefix>_<codon>_..._meta_sequence.txt – one row per matched site:
Site              name          site_from_tis   -10  -9  ...  0  1  ...  +10
YAL001C-t26_1:146 YAL001C-t26_1  146             GAT CCT ... AAA ATA ... CTG
Site– transcript ID and the CDS position of the site.name– transcript ID.site_from_tis– codon offset of the site from the translation initiation site.- Remaining columns – the codon sequence of the
-ato+acontext; position0is the target motif itself.
Example output figure
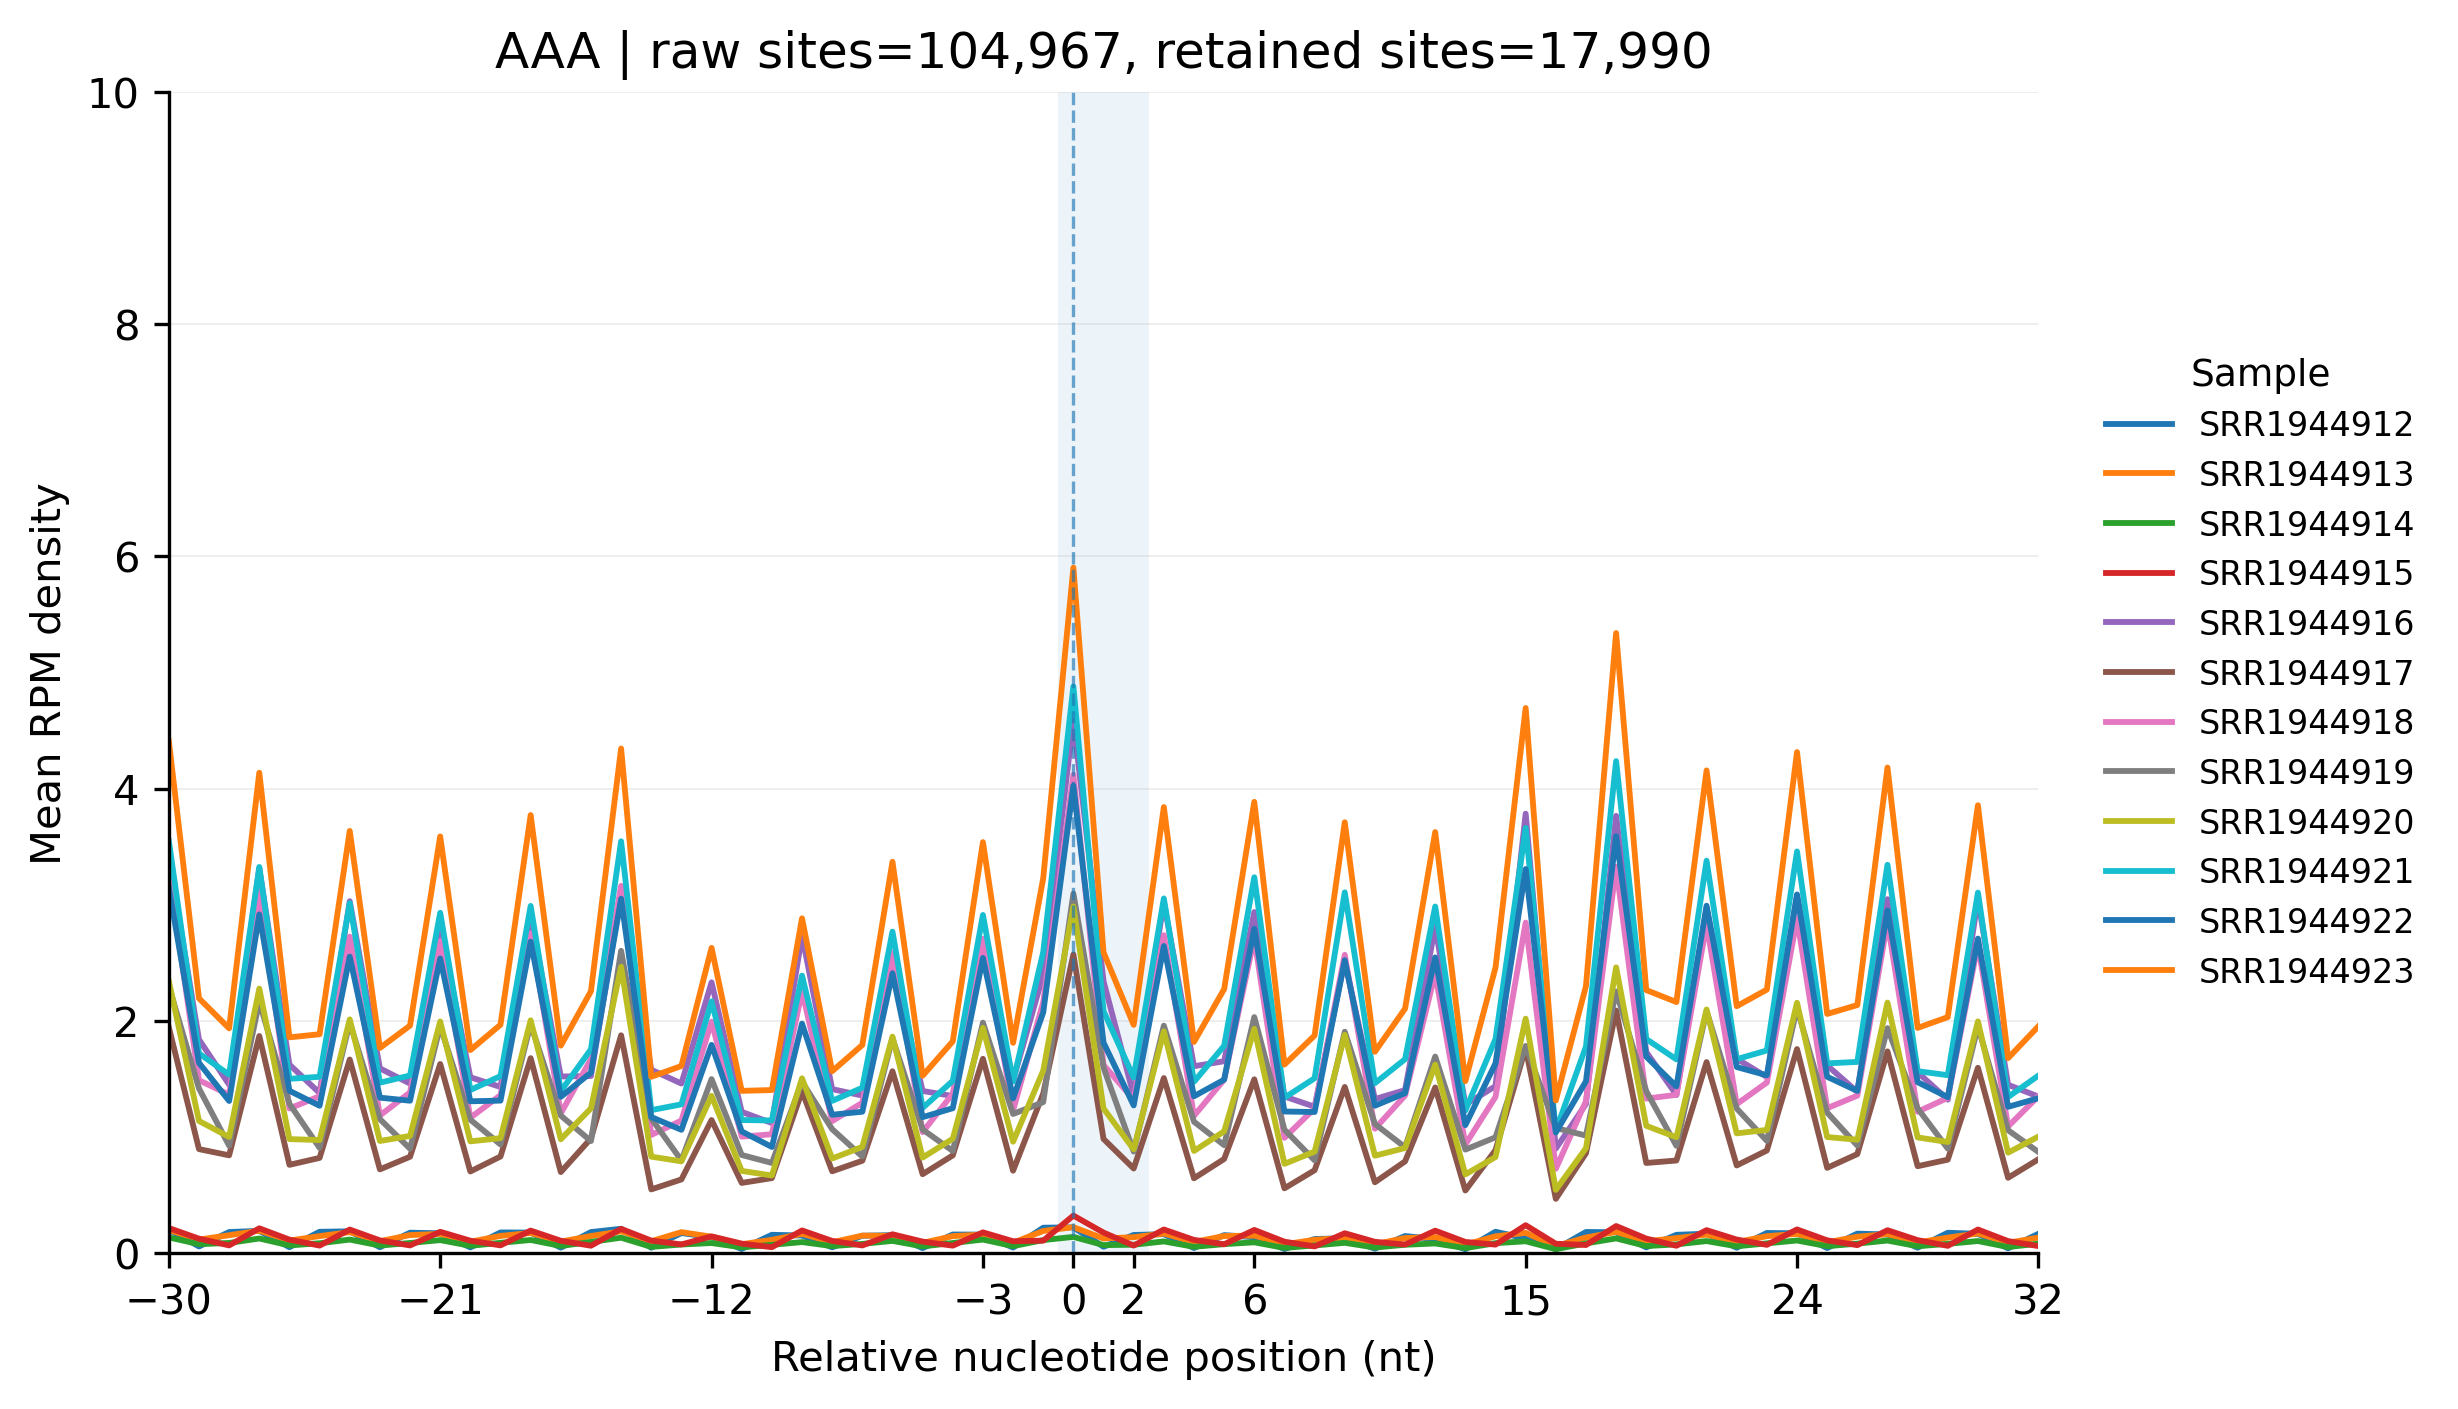
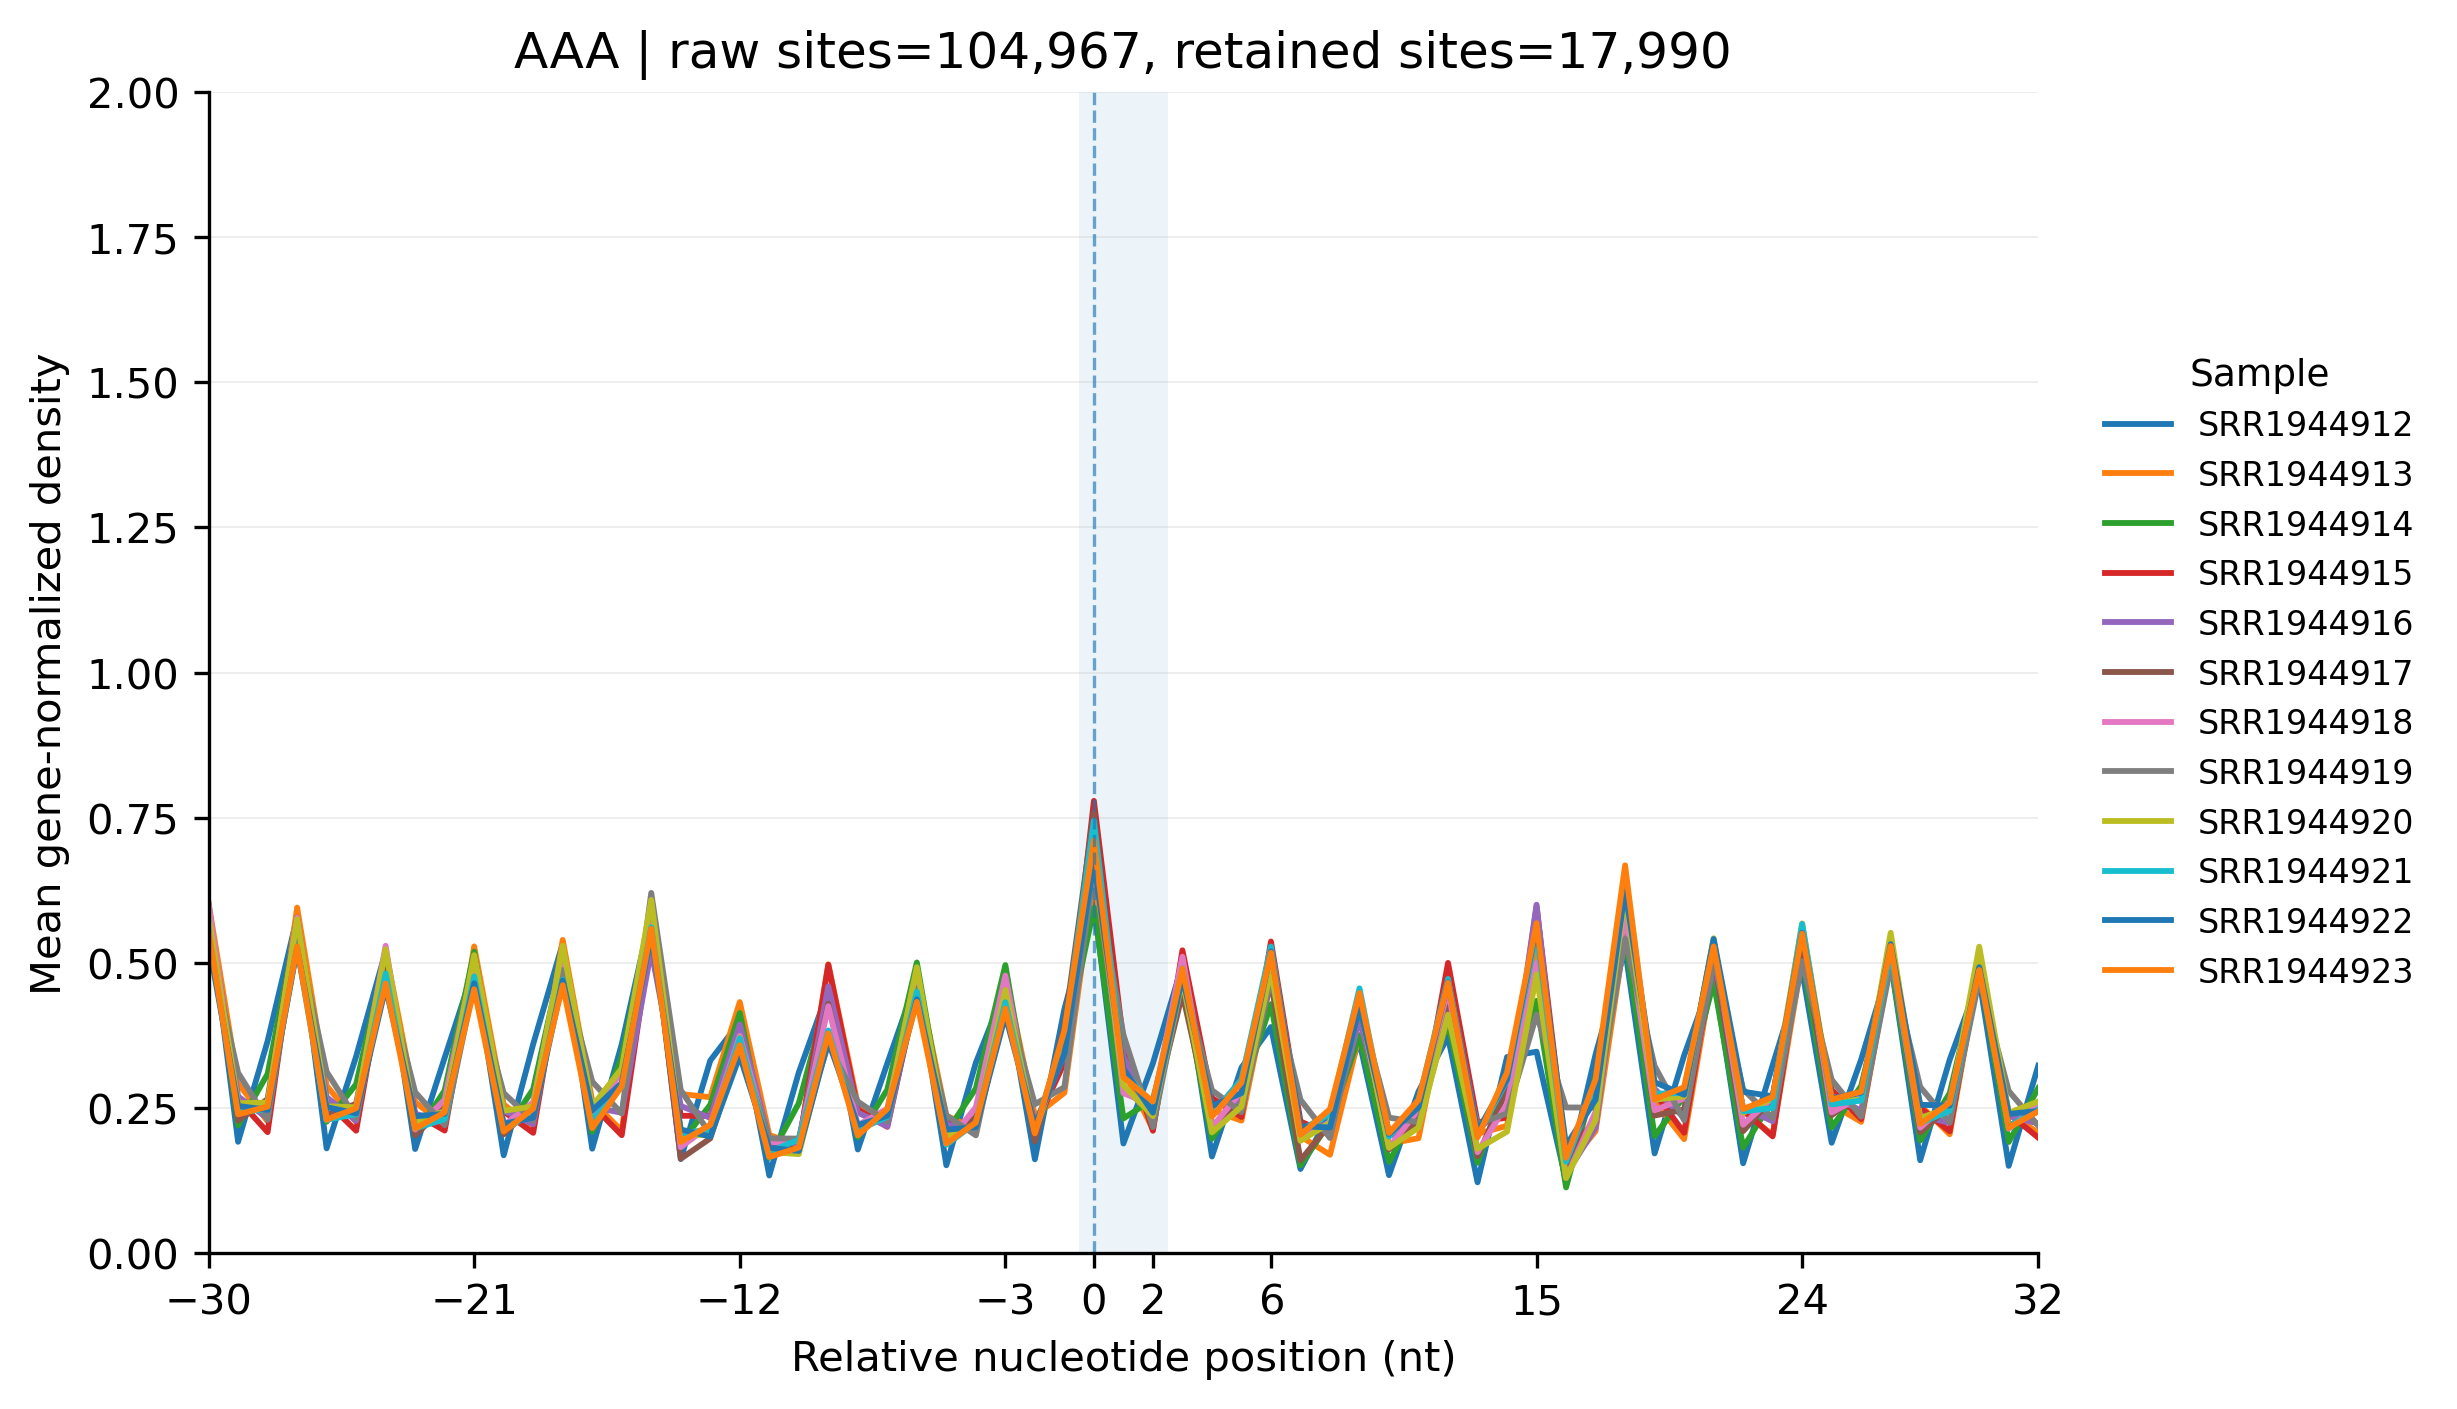
The following example shows the meta profile of the codon AAA aggregated over 17,990 retained sites (from 104,967 raw sites) in the 12 samples of the sce dataset. The AAA motif is drawn at the center; with --unit nucleotide the three reading frames are separated so the tri-nucleotide periodicity of the profile is visible:
For convenient comparison, the density values were normalized to 1 after scaling prior to plotting.
Notes
- The command imports the A-site density internally from the merged RPF table; no separate A-site table is required.
- Target motifs must have lengths divisible by three; other motifs are skipped.
- The output file name records both the total number of matched sites and the number of valid sites after optional filtering.
- Use
-uwhen repeated target codons within the same window may inflate the local background signal. - With
--scale, the y-axis of the figures is labeledMean gene-normalized density; with--normal(but not--scale) it is labeledMean RPM density; otherwiseMean RPF density. - The y-axis upper limit is derived from the data (maximum ×
--ylim-scale, rounded up to a clean tick value) rather than fitted tightly, which avoids exaggerating the tri-nucleotide periodicity.