4.9.6 SeRP properties
serp_properties
serp_properties calculates codon-usage statistics and translated-protein properties from coding-sequence FASTA. When a SeRP peak-classification table is supplied, it additionally compares shared versus condition-specific sequence properties.
Function
Use this command when you want to:
- validate coding sequences and record sequence-level QC (terminal stop removal, internal stop detection, start-codon status);
- calculate per-sequence codon frequency, RSCU, and whole-input codon usage;
- translate nucleotide sequences and calculate protein properties such as GRAVY, flexibility, instability index, isoelectric point, net charge, and secondary-structure propensity fractions;
- calculate the Sharp-Li CAI when a reference CDS FASTA is provided;
- compare shared and condition-specific sequence properties when a
serp_summarypeak-classification table (-p) is provided, including Mann-Whitney U tests with BHFDR correction, local sequence contexts around peakmax_site, position-resolved amino-acid/property profiles, and group comparison figures.
The command works in two modes:
- Sequence mode (no
-p): only the sequence-level pipeline runs. - Peak-group mode (
-p): the sequence-level pipeline runs first, then shared/specific peak groups are extracted, annotated, statistically compared, and plotted.
Input
The primary input is a nucleotide FASTA file containing coding sequences keyed by transcript ID (-f).
Requirements:
- each sequence length should be a multiple of 3, otherwise the sequence fails QC;
- sequences are translated in the current reading frame using
--genetic-code(default NCBI code 1); - a terminal stop codon is removed before protein-property calculation; alternative start codons recognized by the genetic code are normalized to Met;
- sequences containing internal stop codons, ambiguous/invalid codons, or no sense codons fail QC and are excluded from the property tables;
- a
Uin the input is automatically converted toT.
For peak-group mode, -p expects a *.peak_classification.txt file generated by serp_summary (overlap mode). Requirements:
- the table must contain exactly two distinct
comparison_samplevalues; - shared peaks require a
shared_cluster_idcolumn with non-empty values; - local contexts are extracted around each peak
max_siteusing--local-up/--local-down, and--require-complete-local(default) keeps only peaks whose full upstream/downstream window is available.
Parameters
| Parameter | Required | Meaning |
|---|---|---|
-f |
yes | Input coding-sequence FASTA file. |
-o |
yes | Output file prefix. |
-p |
no | *.peak_classification.txt generated by serp_summary. When provided, shared and condition-specific sequence properties are analyzed. Default: None. |
--local-up |
no | Amino acids extracted upstream of each peak max_site. Default: 30. |
--local-down |
no | Amino acids extracted downstream of each peak max_site. Default: 10. |
--require-complete-local |
no | Require every peak-local context to contain the complete requested upstream/downstream window. Pass --no-require-complete-local to allow truncated contexts. Default: True. |
--specific-set |
no | Condition-specific peak set used for statistics and figures: all or significant. Tables always retain both all-specific and significant-specific groups. Default: all. |
--min-group-size |
no | Minimum non-overlapping transcript number per group required for a statistical test. Default: 3. |
--genetic-code |
no | NCBI genetic code identifier used for translation and codon annotation. Default: 1. |
--cai-reference |
no | Reference CDS FASTA used to build the Sharp-Li codon adaptiveness index. CAI remains NA when this argument is omitted. Default: None. |
--charge-ph |
no | pH used to calculate full-protein net charge and charge density. Default: 7.0. |
--plot |
no | Generate peak-group sequence-property figures when -p is provided. Pass --no-plot to write tables only. Default: True. |
--output-format |
no | Figure output format: pdf, png, or both. Default: pdf. |
--font-size |
no | Base figure font size. Default: 9.0. |
--dpi |
no | PNG output resolution. Default: 300. |
Output
All outputs share the prefix set by -o. The sequence-level tables are always written; the .Peak*, _group_*, _local_*, _position_*, _property_statistics*, and figure outputs appear only in peak-group mode.
Sequence-level output
| Output | Description |
|---|---|
<prefix>.SequenceQC.txt |
Per-sequence validation record: status (PASS/WARN/FAIL), issues, input/coding length, sense-codon number, protein length, start-codon and start status, terminal stop, internal-stop number, invalid-codon number. |
<prefix>_summary.txt |
Metric table with input/valid/pass/warning/failed sequence counts, genetic code, charge pH, and whether CAI was calculated. |
<prefix>_frequency.txt |
Per-sequence codon frequency table (one column per sense codon). |
<prefix>_rscu.txt |
Per-sequence RSCU table (one column per sense codon). |
<prefix>_cai.txt |
Per-sequence CAI table (Gene, Length, CAI, CAI_Reference). |
<prefix>_whole_codon_usage.txt |
Whole-input codon usage summary: codon, amino acid, count, frequency, RSCU, and relative adaptiveness. |
<prefix>_aa_composition.txt |
Per-sequence amino-acid composition (ID, AA, AA3, Count, Fraction). |
<prefix>.Properties.txt |
Translated-protein property table (one row per sequence). |
<prefix>_cai_reference_qc.txt |
Reference-sequence QC when --cai-reference is provided. |
The <prefix>.Properties.txt table contains:
| Column | Description |
|---|---|
ID |
FASTA record ID. |
Seq |
Translated amino-acid sequence (terminal stop removed). |
Length |
Amino-acid sequence length. |
CDS_Length_nt |
Coding nucleotide length (terminal stop excluded). |
Sense_Codon_Number |
Number of sense codons. |
Start_Codon |
Observed start codon. |
Terminal_Stop |
Removed terminal stop codon (empty if none). |
GC / GC1 / GC2 / GC3 |
Overall and codon-position GC content. |
CAI |
Sharp-Li codon adaptation index (NA without --cai-reference). |
Charge_pH |
pH used for charge calculations. |
Gravy |
Grand average of hydropathy. |
Aromaticity |
Aromatic amino-acid fraction. |
Flexibility |
Average predicted flexibility (NA for proteins shorter than 9 residues). |
Instability |
Instability index. |
Isoelectric_Point |
Predicted isoelectric point. |
Net_Charge_pH |
Predicted net charge at Charge_pH. |
Charge_Density |
Net charge divided by protein length. |
Positive_Fraction |
Positive-charged residue fraction (K, R, H). |
Negative_Fraction |
Negative-charged residue fraction (D, E). |
Aromatic_Fraction |
Aromatic residue fraction (F, W, Y). |
Proline_Fraction |
Proline residue fraction. |
Glycine_Fraction |
Glycine residue fraction. |
Helix_Propensity_Fraction |
Predicted helix propensity fraction. |
Turn_Propensity_Fraction |
Predicted turn propensity fraction. |
Sheet_Propensity_Fraction |
Predicted sheet propensity fraction. |
Peak-group output
| Output | Description |
|---|---|
<prefix>.PeakSequenceQC.txt |
Per-peak local-context validation: status, issue, requested/extracted context boundaries, and protein length. |
<prefix>.PeakProperties.txt |
Per-peak local-context properties (one row per peak). |
<prefix>.SignificantSpecificPeakProperties.txt |
Subset of PeakProperties.txt restricted to significant condition-specific peaks. |
<prefix>_group_membership.txt |
Assignment of sequences/peaks to analysis groups (shared, <sample>_specific, <sample>_significant_specific). |
<prefix>_group_protein_properties.txt |
Full-sequence protein properties aggregated by group (columns mirror Properties.txt plus a Group column). |
<prefix>_group_codon_usage.txt |
Codon usage aggregated by group (Group, Codon, AA, Abbr., Count, Frequency, RSCU). |
<prefix>_group_aa_composition.txt |
Amino-acid composition aggregated by group. |
<prefix>_local_aa_composition.txt |
Amino-acid composition of local contexts by group. |
<prefix>_position_aa_profile.txt |
Position-resolved amino-acid enrichment (Group, Relative_Position, AA, Count, Fraction, background counts, Log2_Enrichment_vs_All). |
<prefix>_position_property_profile.txt |
Position-resolved property profile (mean hydropathy, mean signed charge class, positive/negative/aromatic fractions). |
<prefix>_property_statistics.txt |
Per-feature Mann-Whitney U tests between group pairs with BHFDR correction and rank-biserial effect size; overlapping transcripts are removed before testing. |
<prefix>_group_summary.txt |
Group-level summary: peak count, transcript count, local-context count, complete-window requirement, and local window settings. |
The <prefix>.PeakProperties.txt local-context columns include:
| Column | Description |
|---|---|
Peak_ID / transcripts / gene_name |
Peak and transcript identifiers. |
Analysis_Group |
Group label. |
comparison_sample |
Condition label. |
peak_category |
shared or specific. |
peak_start / peak_end / max_site |
Peak coordinates and anchor site. |
significance_status / is_significant_specific |
Significance annotations. |
Shared_Member_Number |
Cluster size for shared peaks. |
Context_Start / Context_End |
Extracted local-context positions. |
Relative_Start / Relative_End |
Context positions relative to max_site. |
Context_AA / Context_NT |
Extracted amino-acid and nucleotide sequences. |
Local_Length_aa |
Local-context length in amino acids. |
GC / GC3 |
Local-context GC content. |
Gravy |
Local-context hydropathy. |
Signed_Charge_Fraction |
Signed net-charge fraction of the local context. |
Positive_Fraction / Negative_Fraction |
Charged residue fractions of the local context. |
Aromatic_Fraction / Proline_Fraction / Glycine_Fraction |
Local-context residue fractions. |
Figures
With -p and --plot, six figures are produced (extension controlled by --output-format):
| Figure | Description |
|---|---|
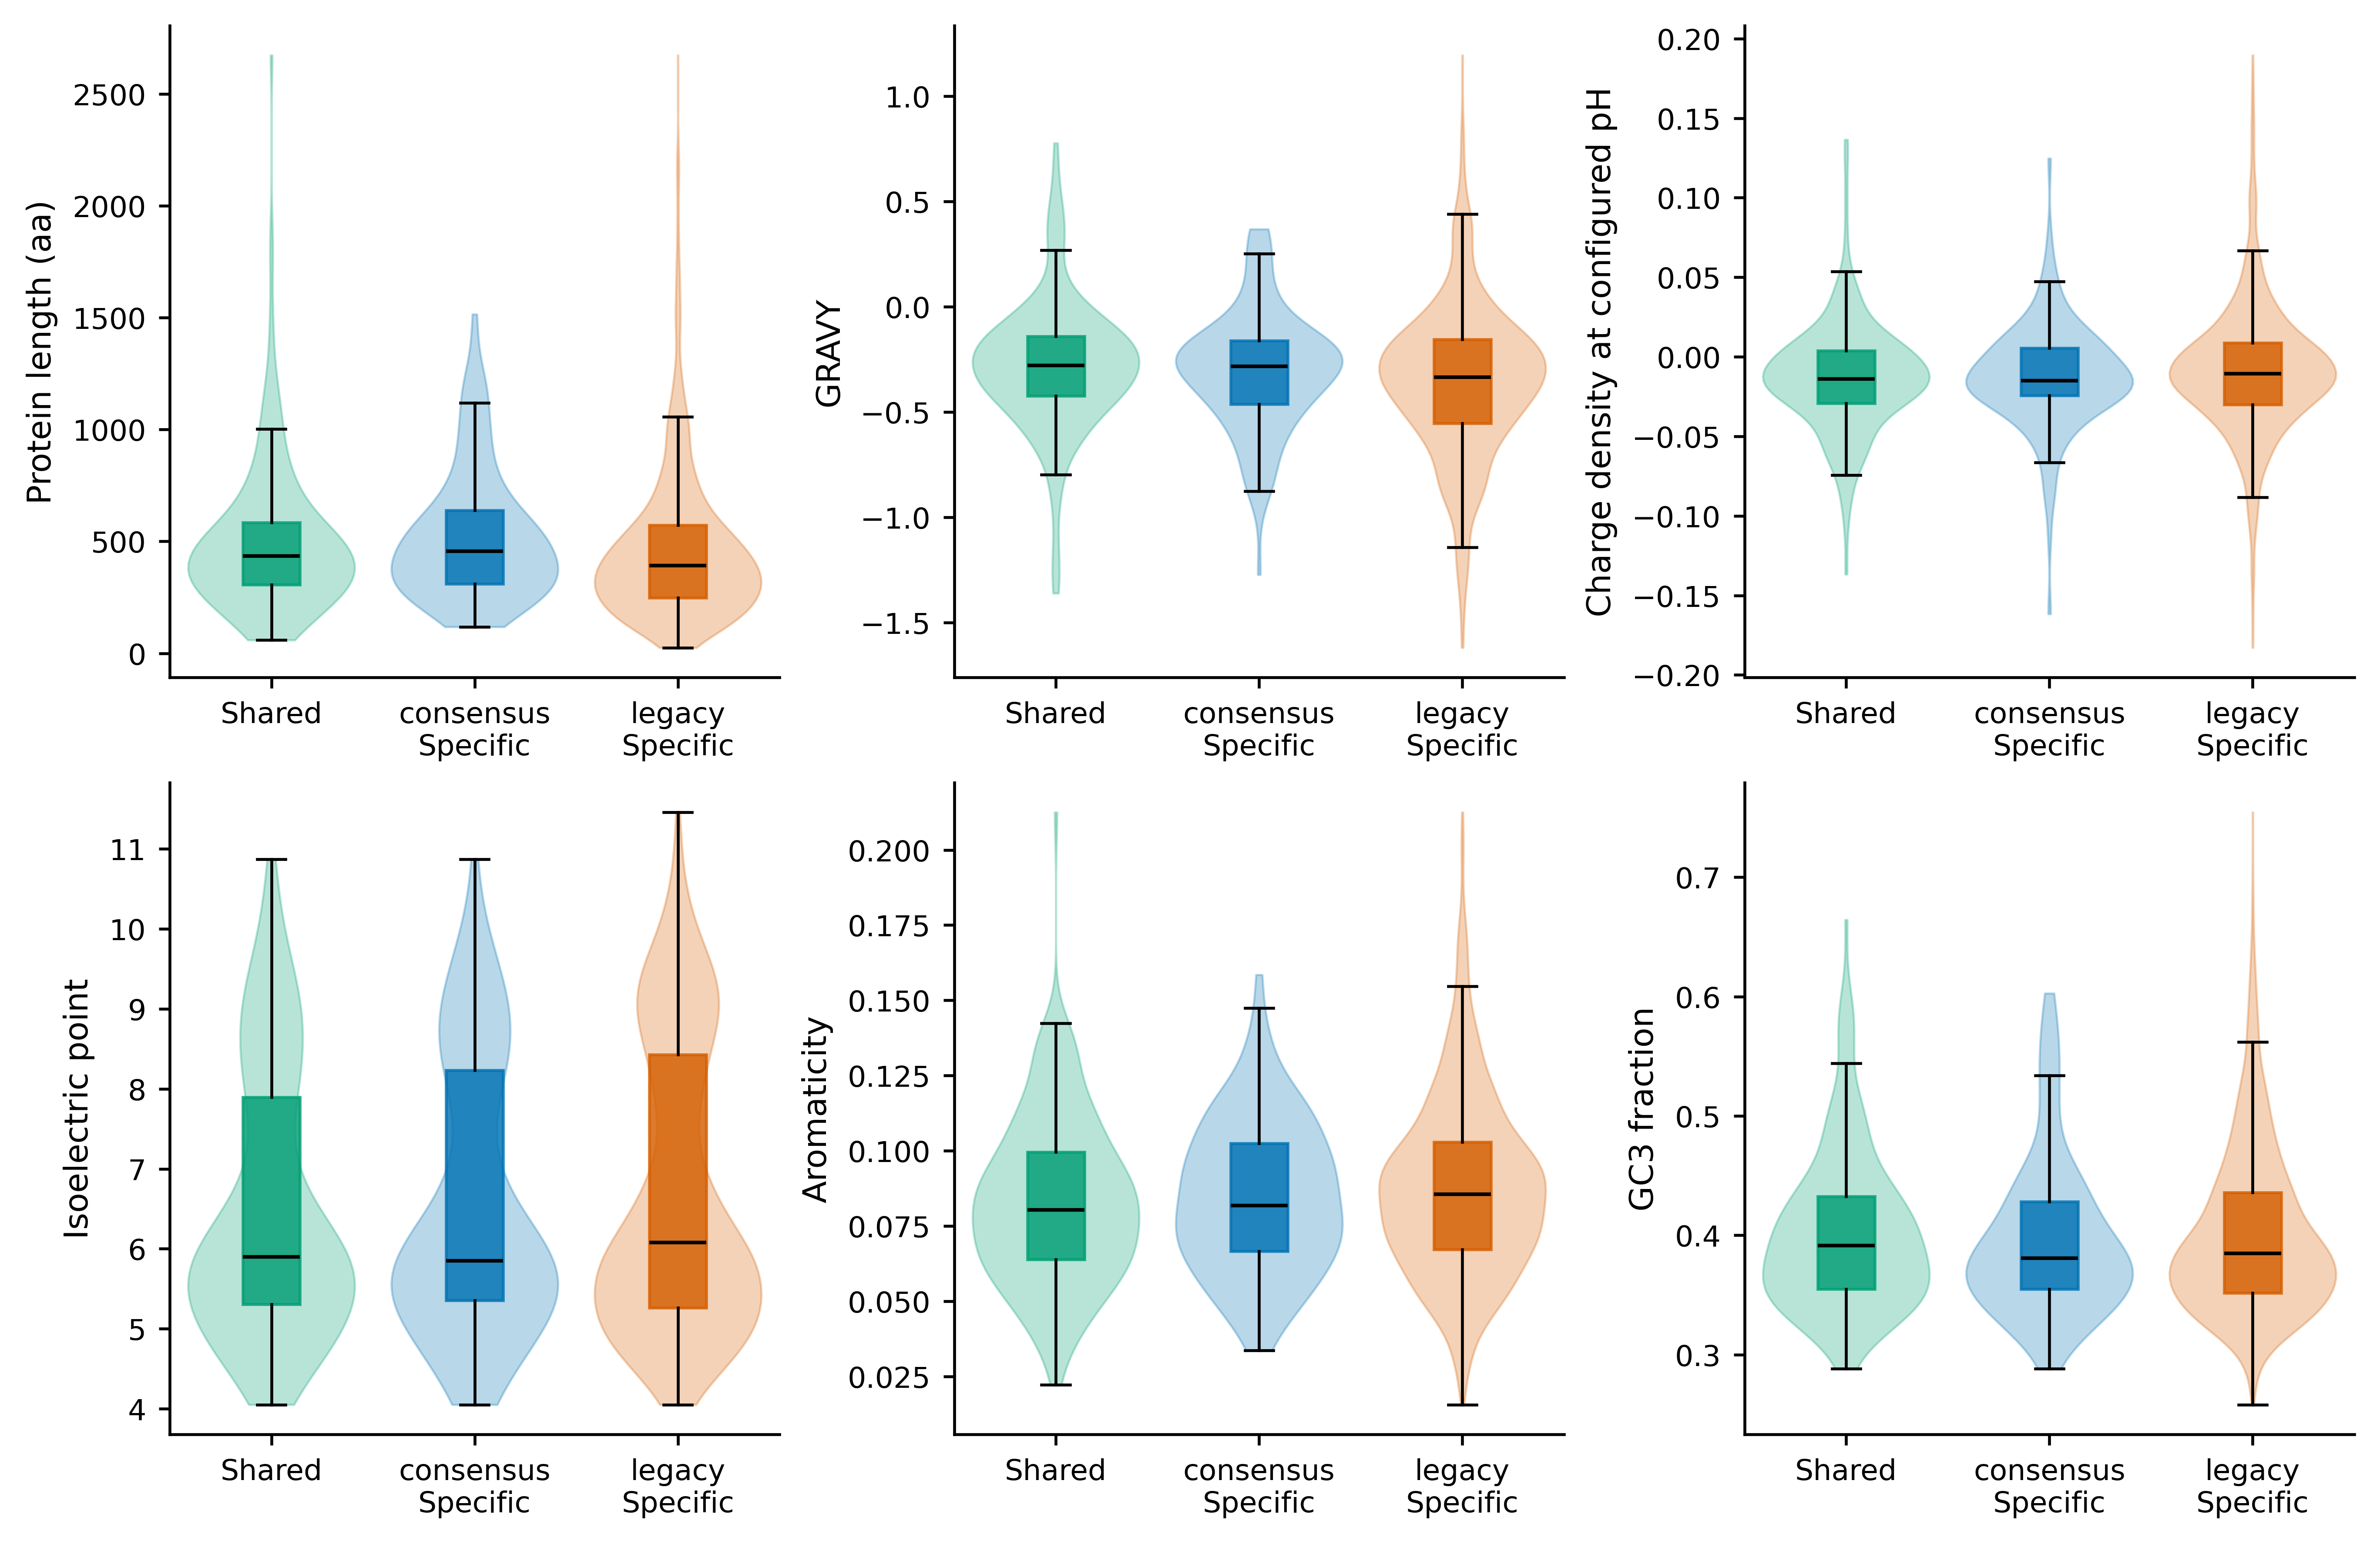
<prefix>.protein_properties.<ext> |
Violin + box grid of full-sequence protein properties by group. |
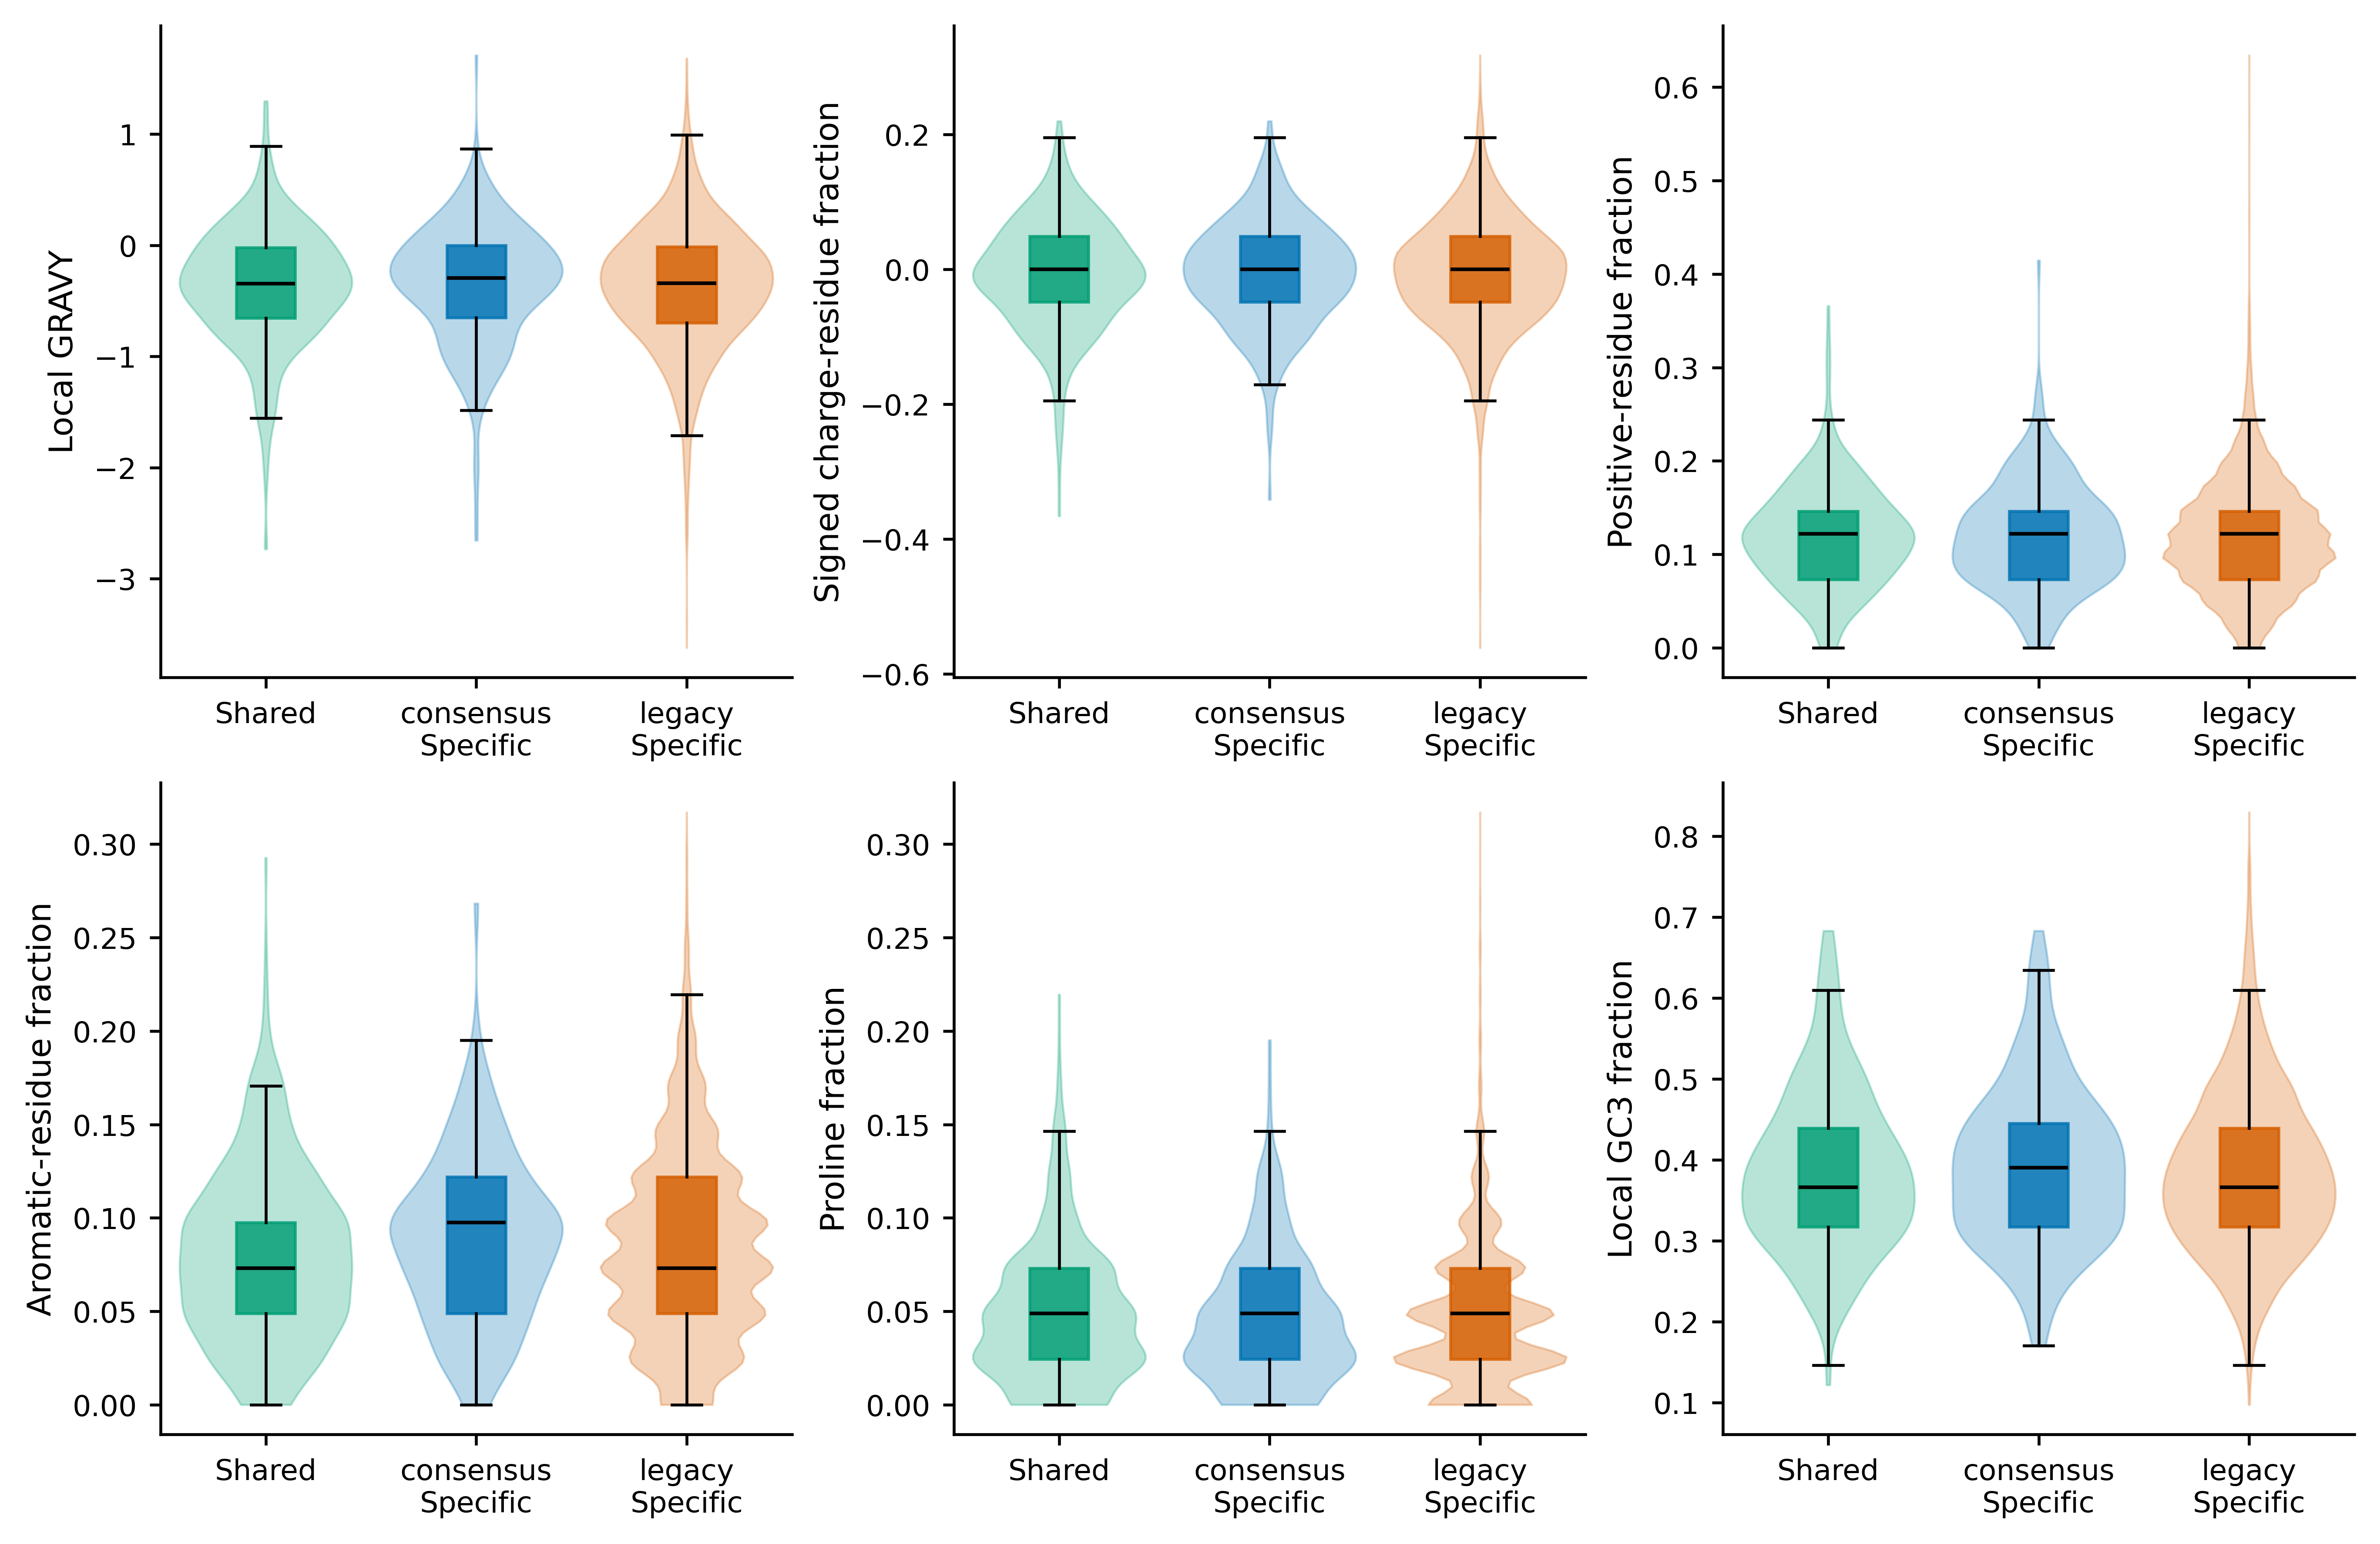
<prefix>.local_properties.<ext> |
Violin + box grid of local-context properties by group. |
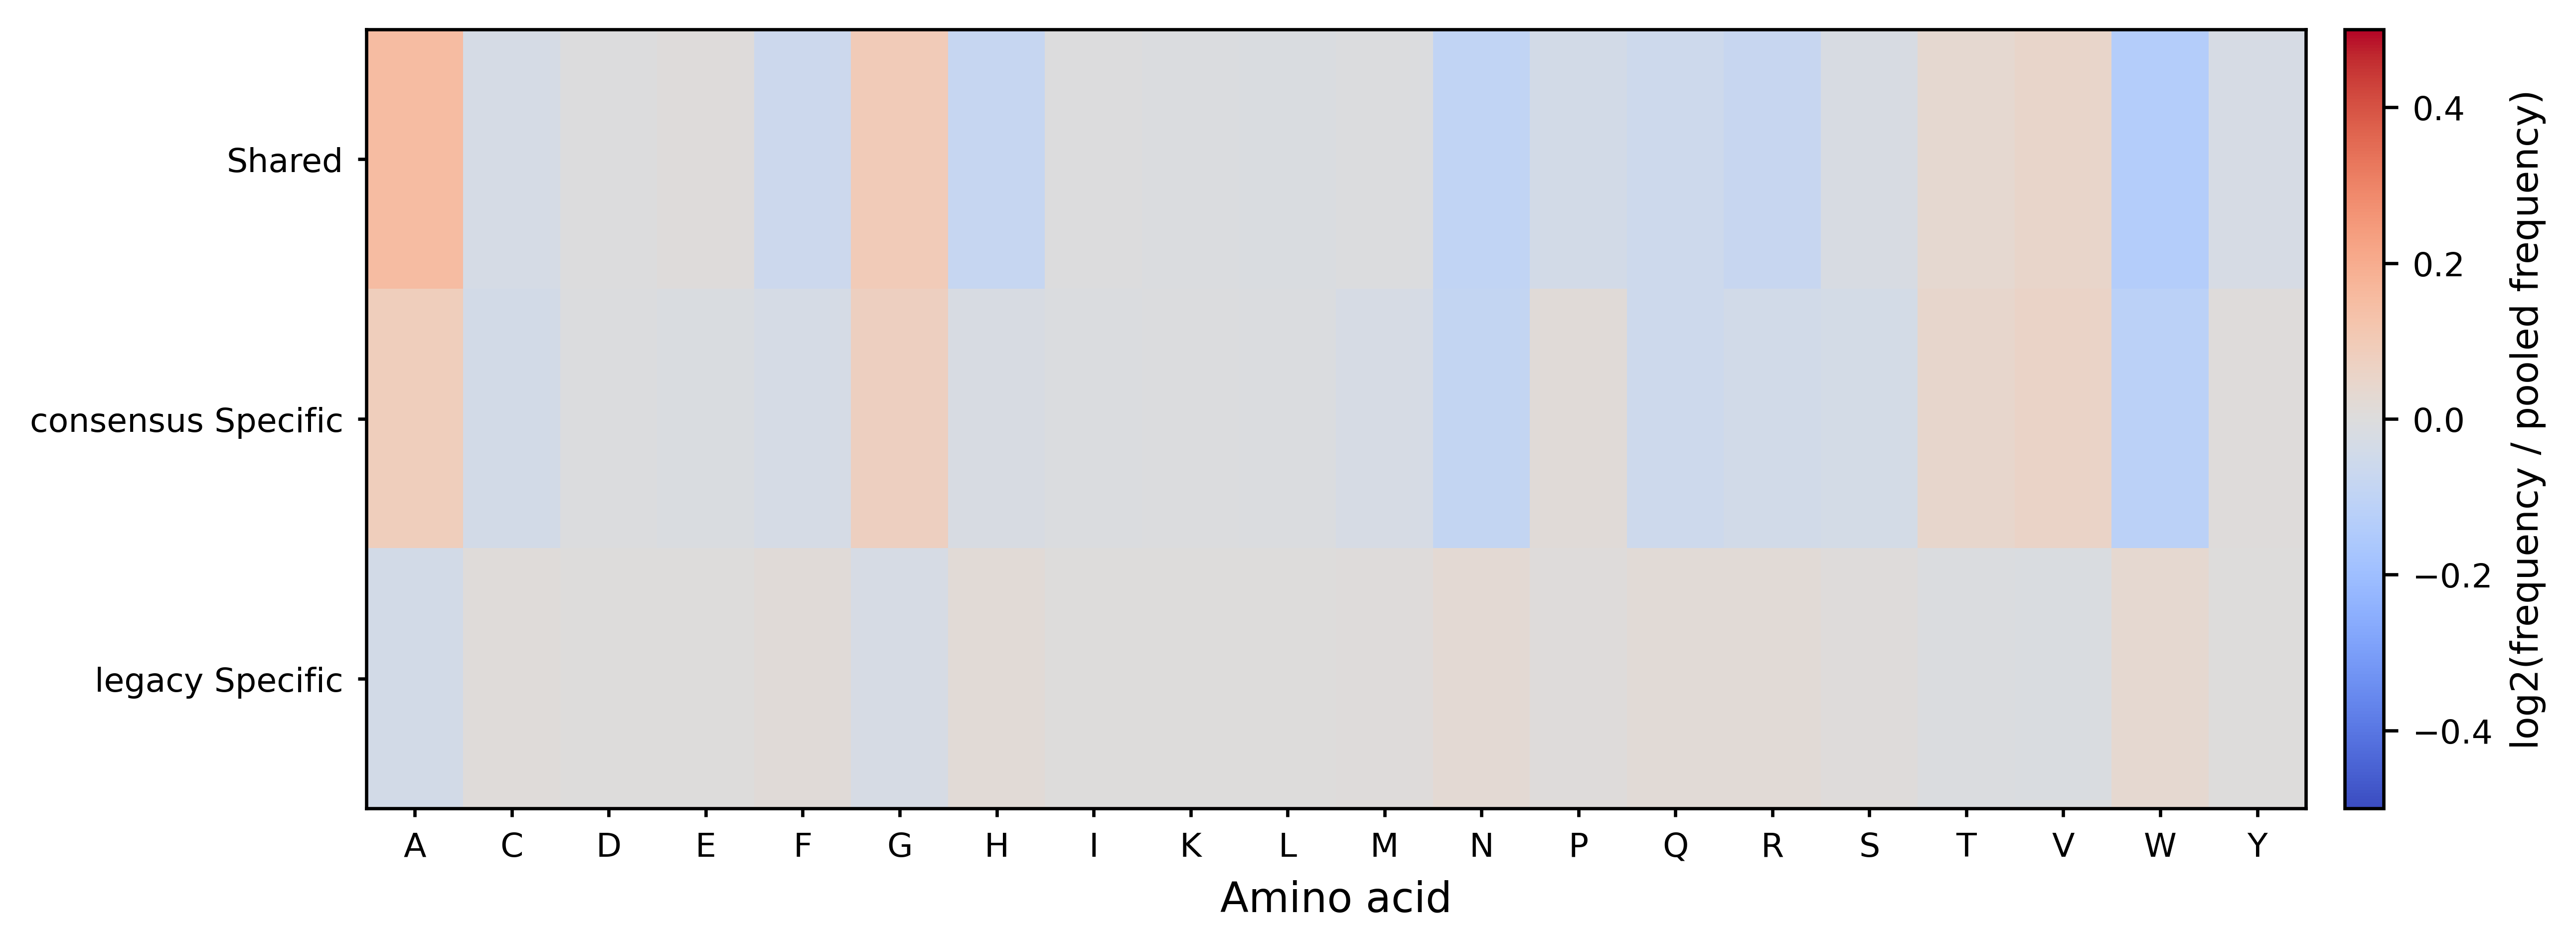
<prefix>.aa_composition_heatmap.<ext> |
Amino-acid composition heatmap across groups. |
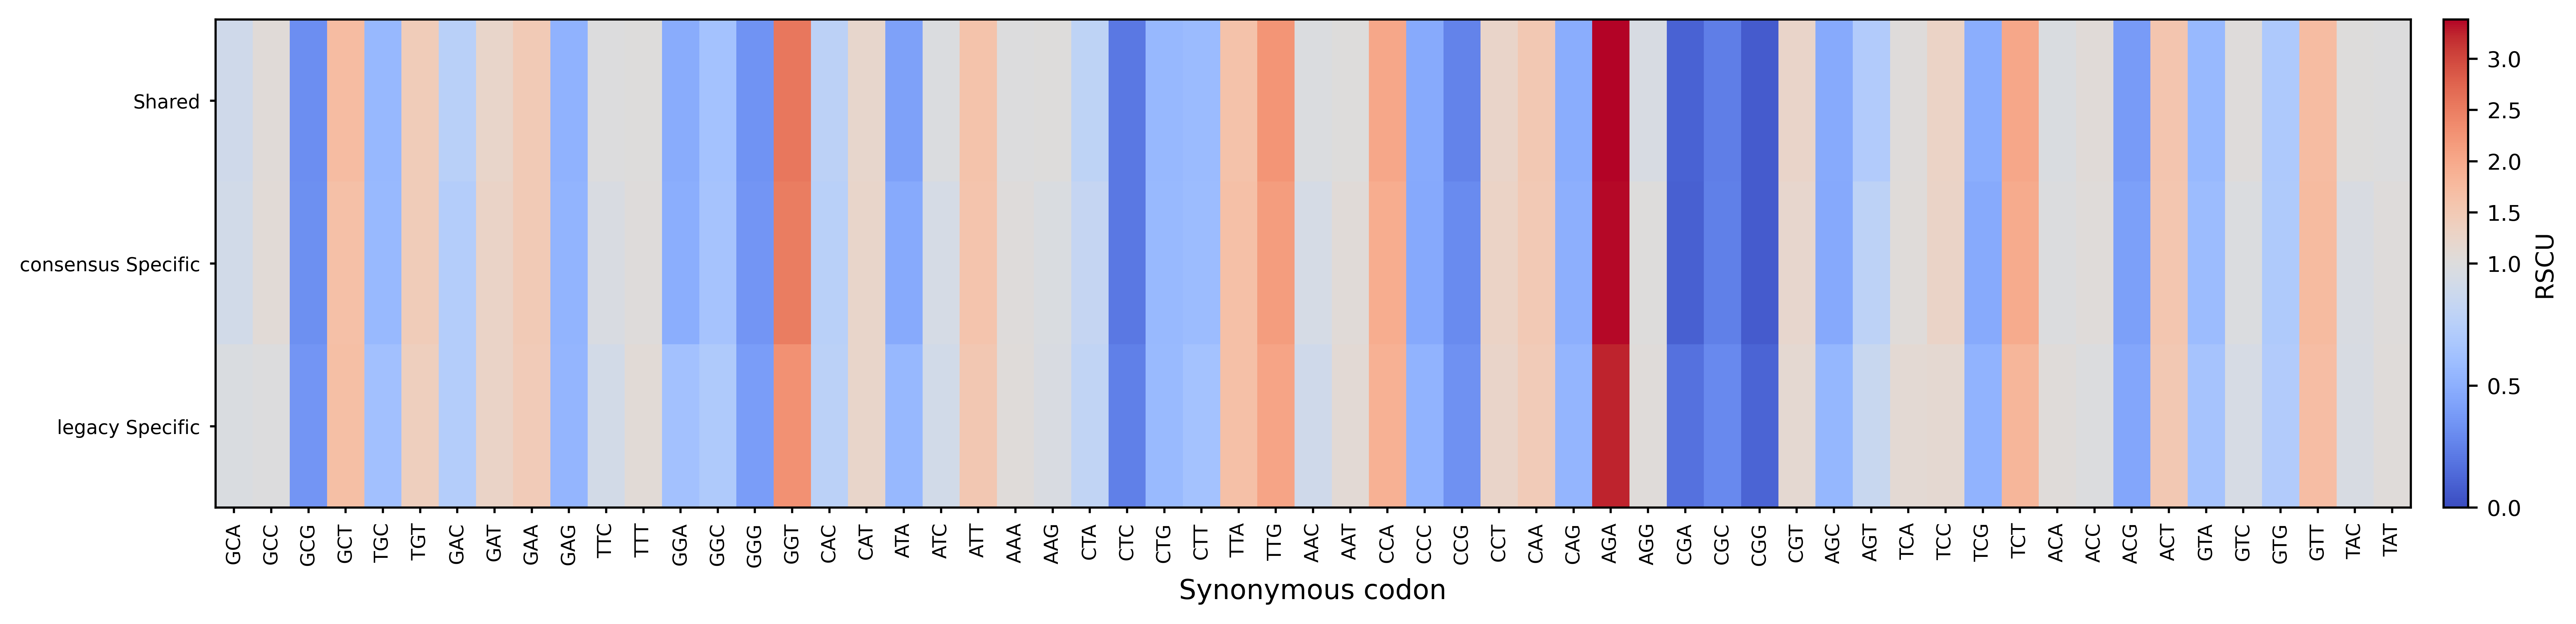
<prefix>.rscu_heatmap.<ext> |
RSCU heatmap across groups. |
<prefix>.local_position_profiles.<ext> |
Position-resolved local property profiles around max_site. |
<prefix>.position_aa_enrichment.<ext> |
Position-resolved amino-acid enrichment (log2 vs. all sequences). |
Example figures:
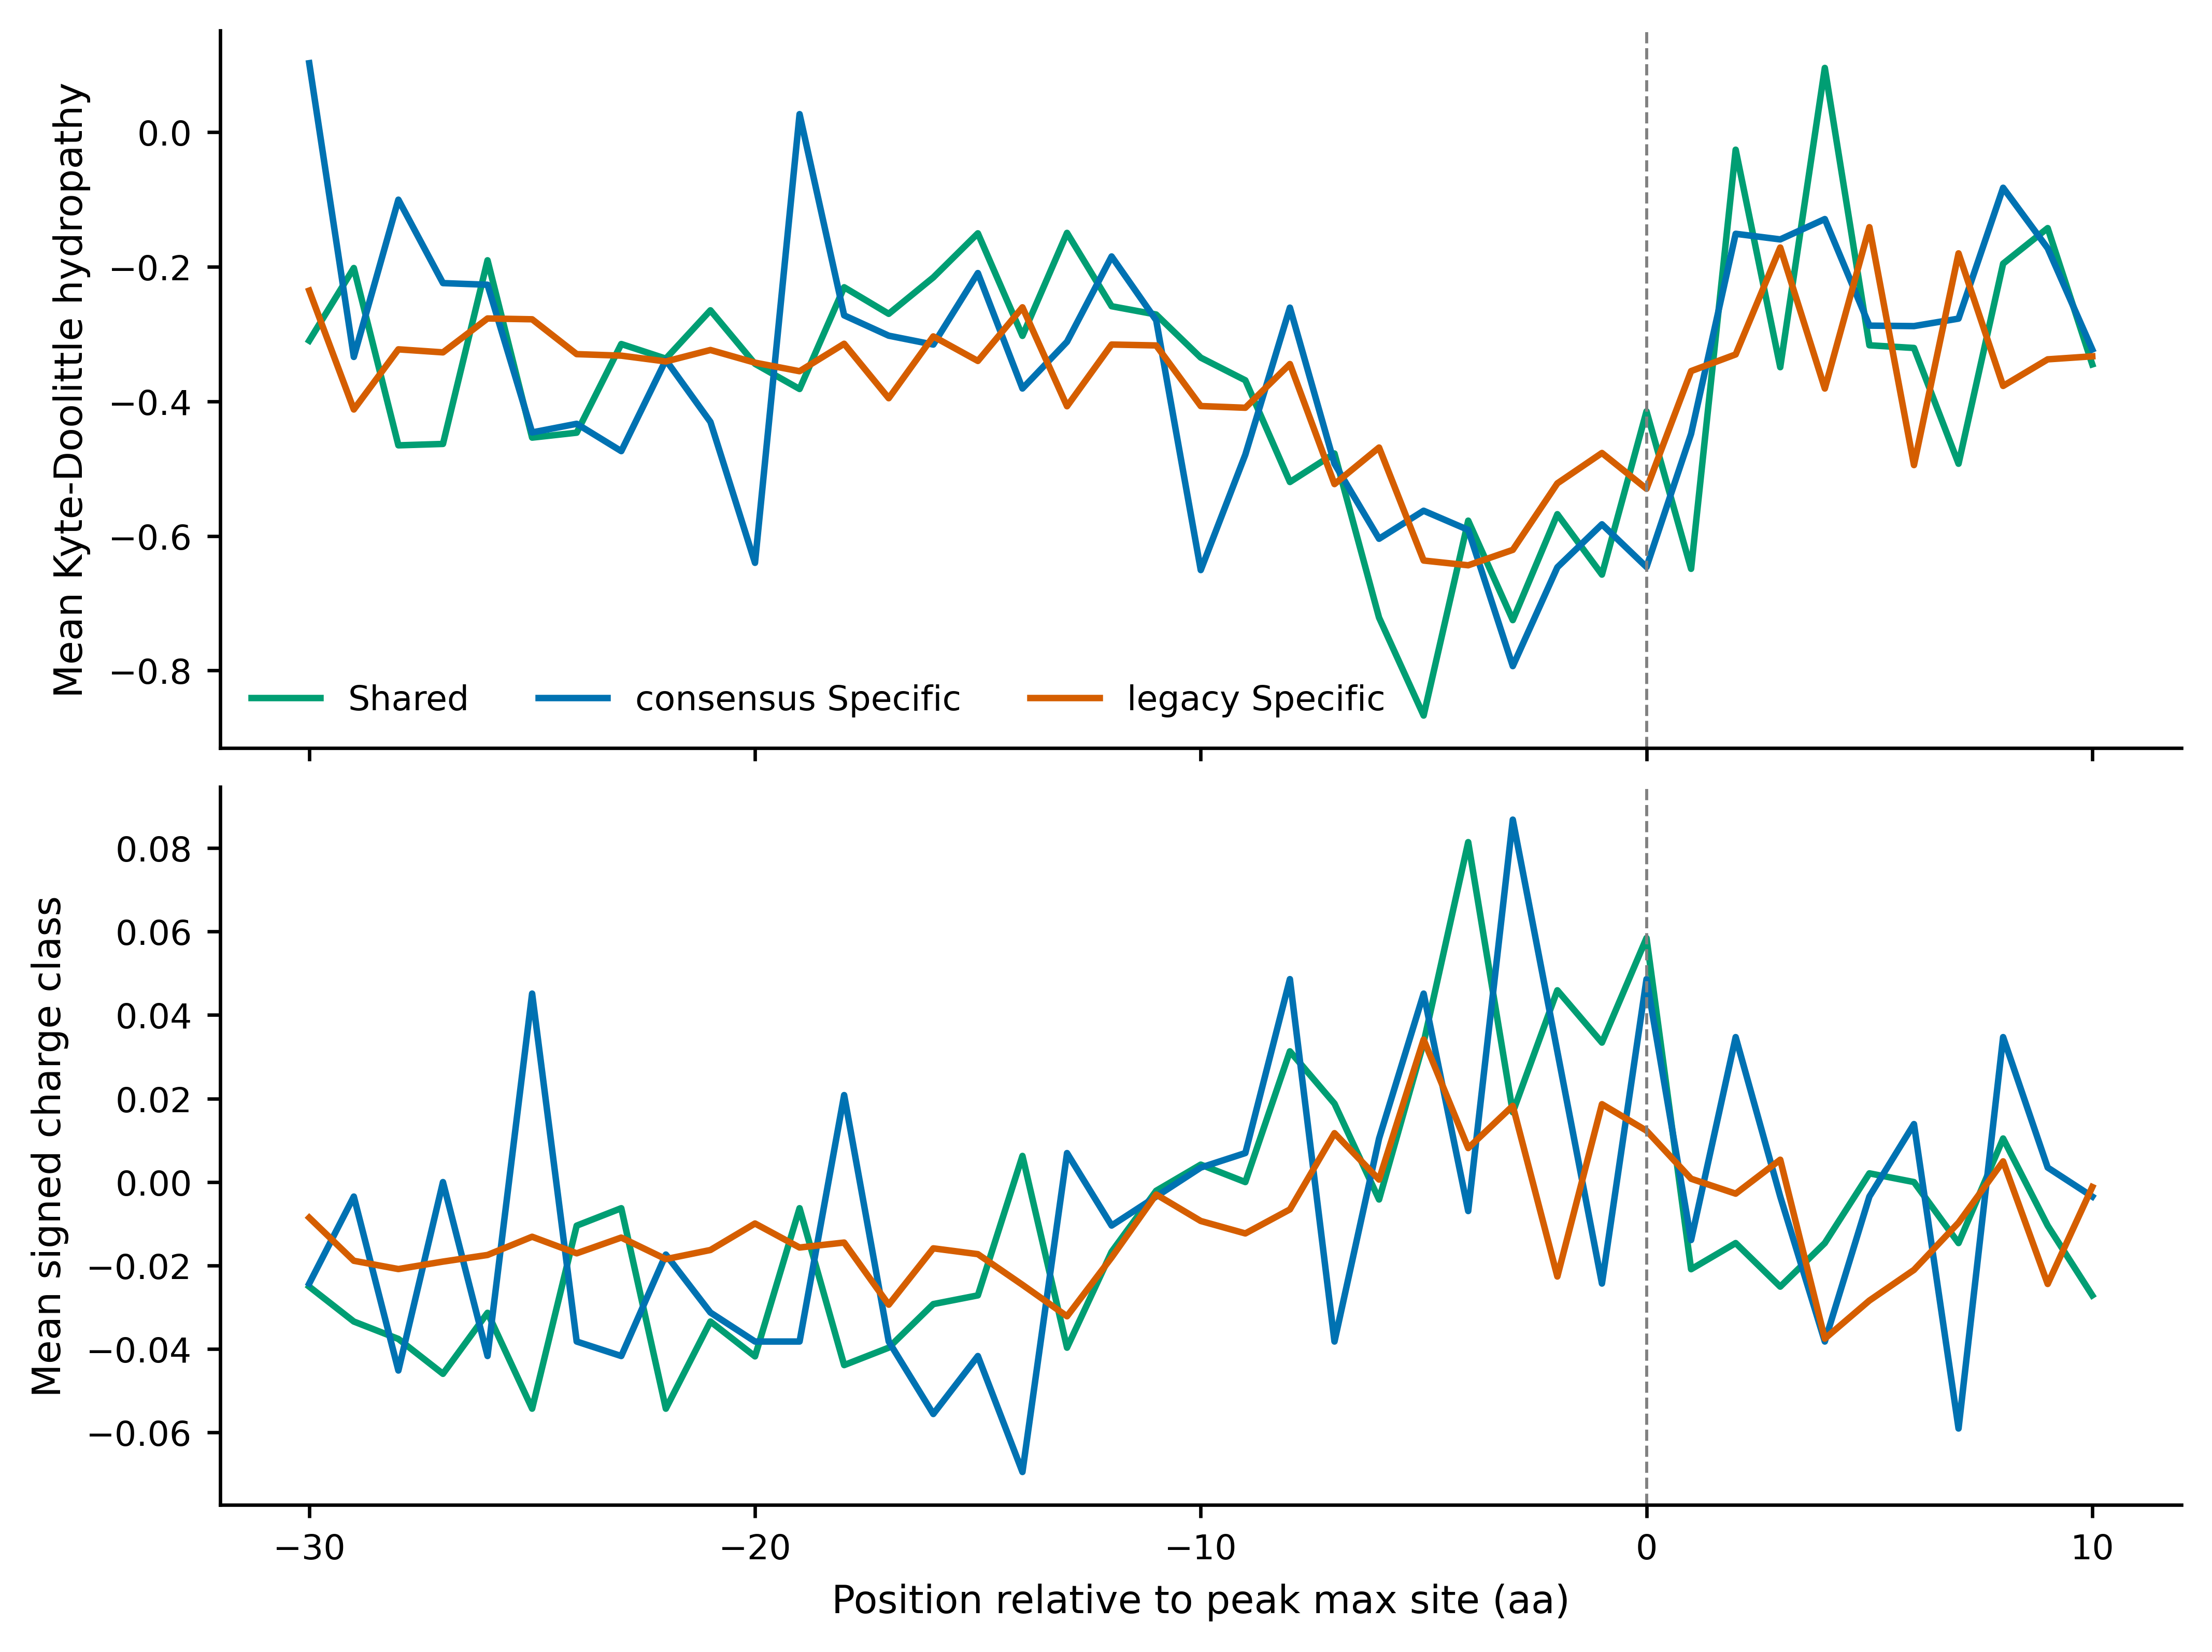
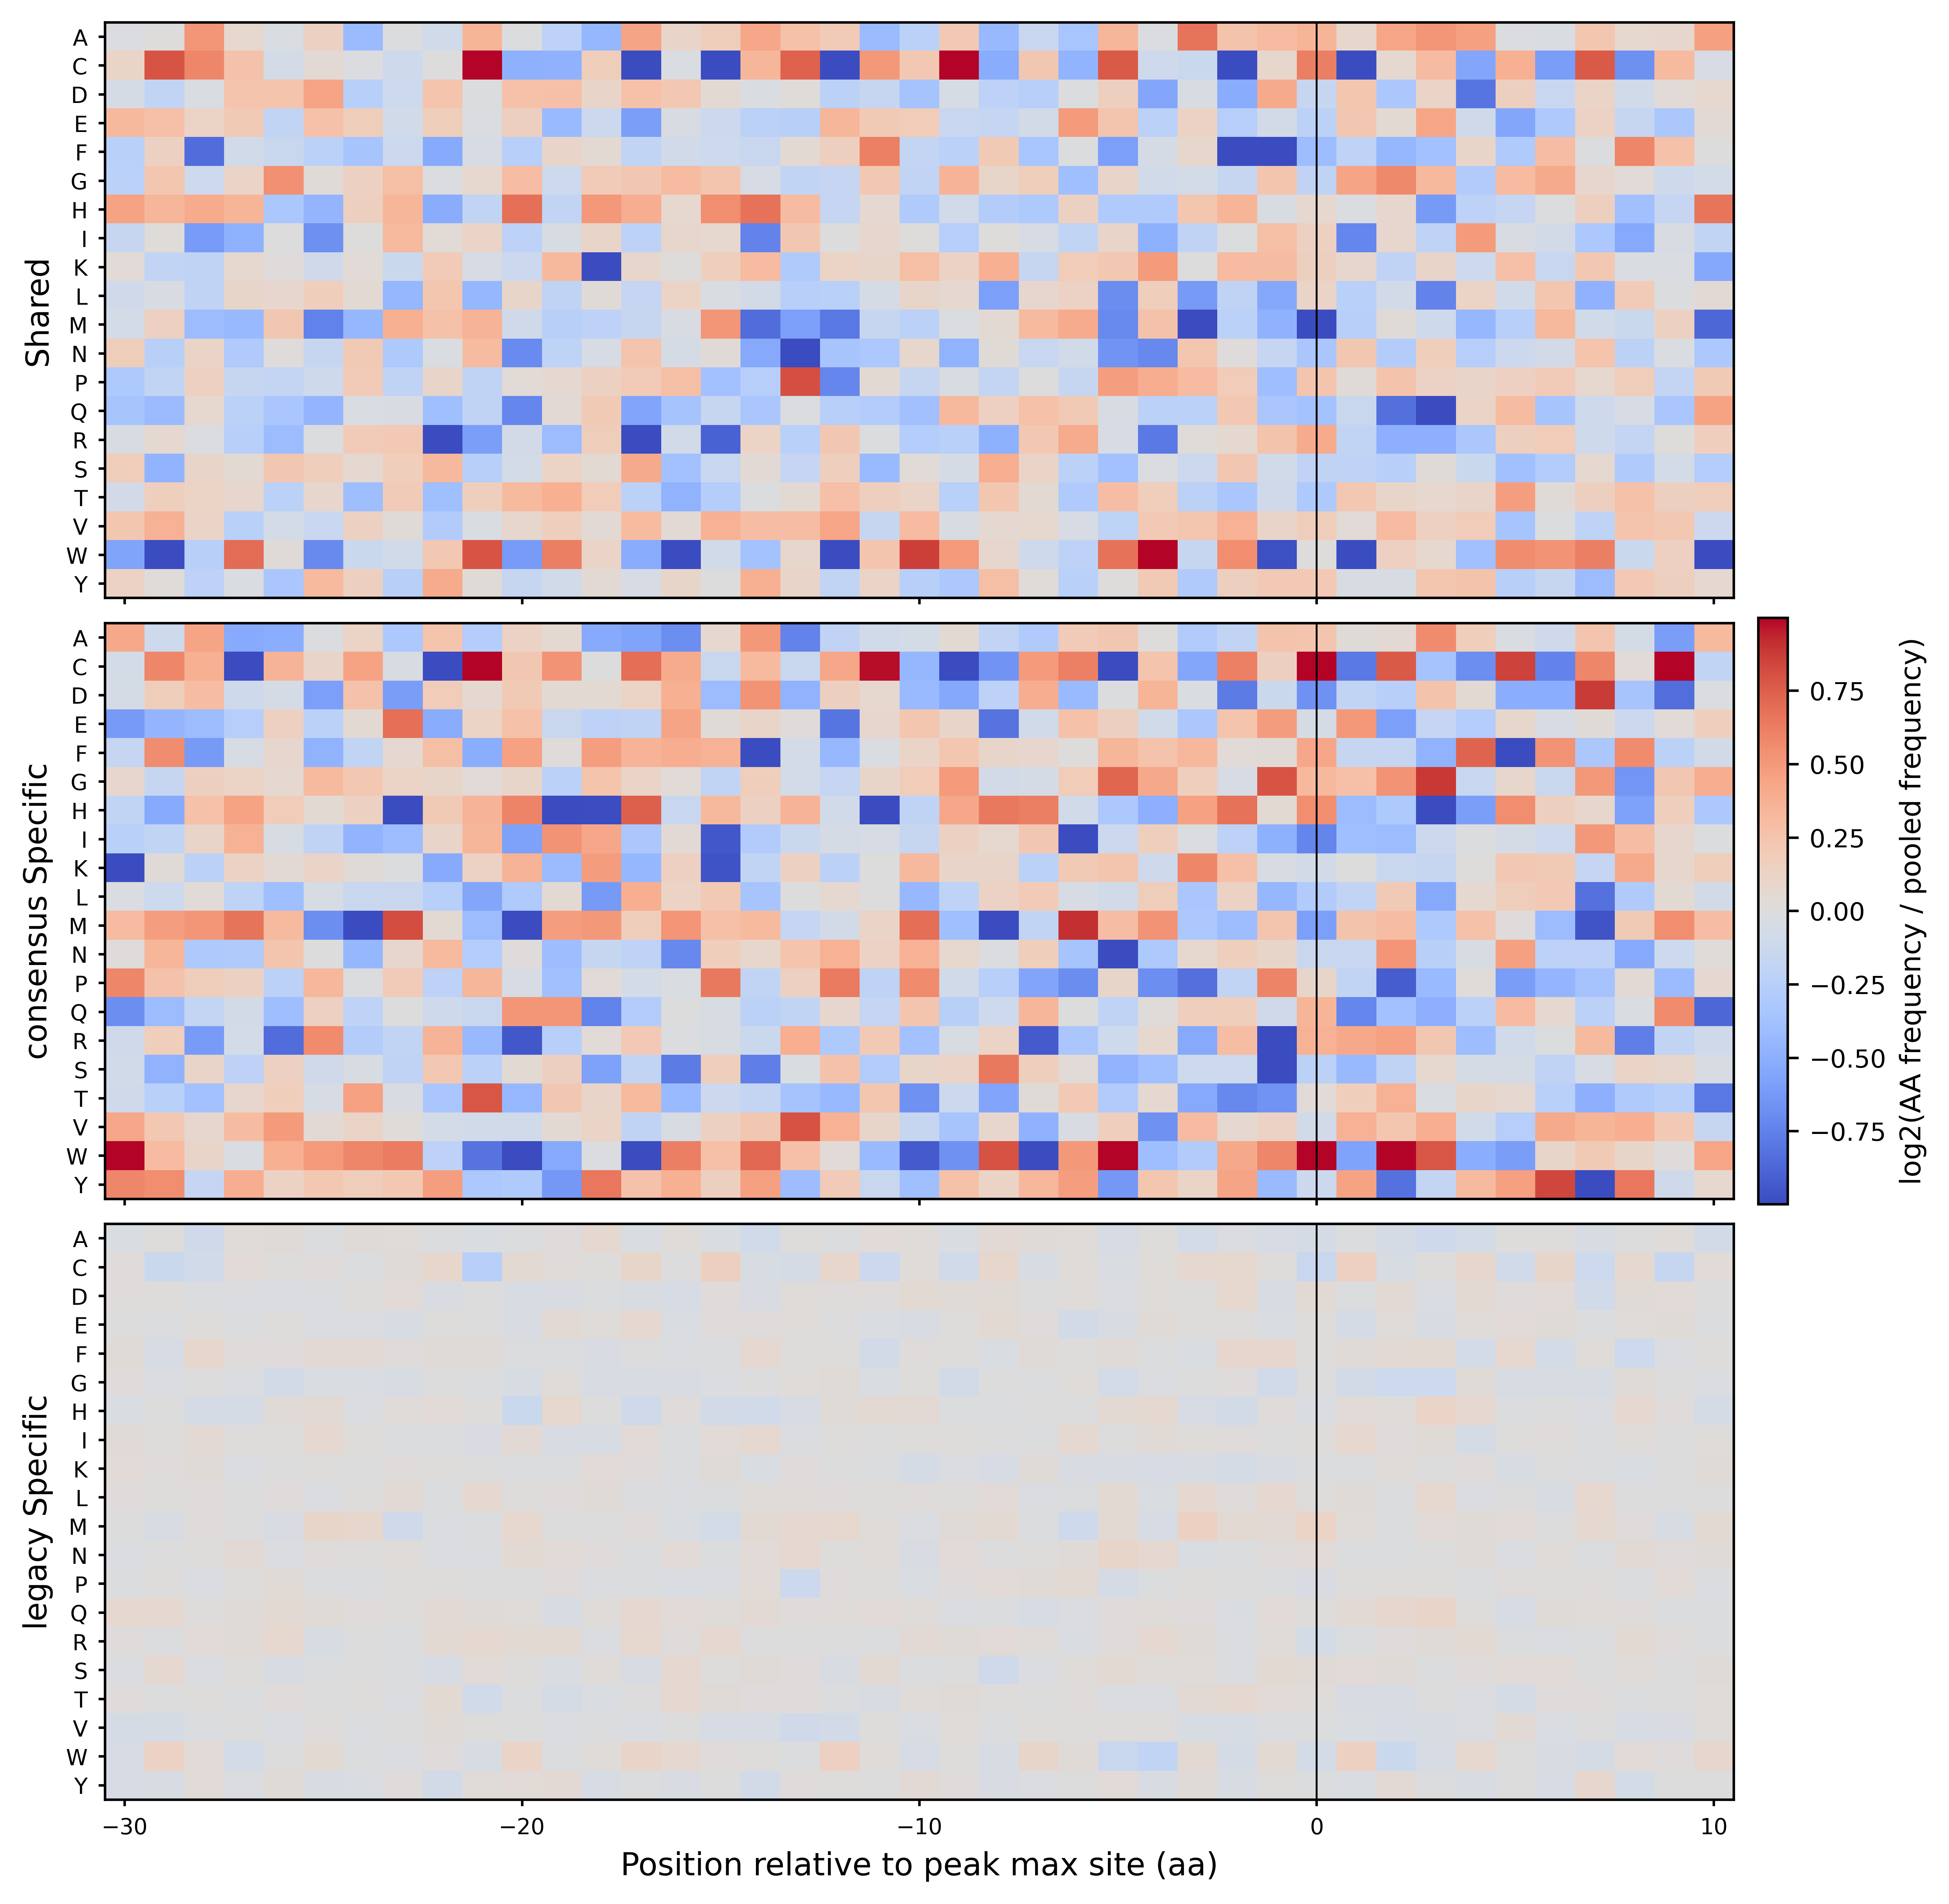
Examples
Calculate sequence properties for CDS sequences:
Calculate properties with Sharp-Li CAI against a reference:
serp_properties \
  -f sce.norm.cds.fa \
  --cai-reference high_expression_cds.fa \
  -o sce_properties_cai
Compare shared and condition-specific sequence properties using a serp_summary peak-classification table, with local contexts and PNG+PDF figures:
serp_properties \
  -f sce.norm.cds.fa \
  -p legacy_vs_consensus.peak_classification.txt \
  --local-up 30 \
  --local-down 10 \
  --specific-set all \
  -o legacy_vs_consensus \
  --output-format both \
  --dpi 600
Notes
- The command expects nucleotide sequences, not amino-acid FASTA input.
- Sequence QC is recorded in
<prefix>.SequenceQC.txt;FAILsequences are excluded from the property tables, andWARNsequences are kept. - CAI requires
--cai-reference; without it, theCAIcolumn isNAandcai_calculatedisFalsein the summary. Flexibilityis reported asNAfor proteins shorter than 9 residues.- In peak-group mode, transcripts shared between compared groups are removed before statistical testing, and tests require at least
--min-group-sizenon-overlapping transcripts per group. - The generated
<prefix>.Properties.txt,<prefix>.PeakProperties.txt, and<prefix>.SequenceQC.txtuse a dot before the suffix, while the remaining outputs use underscores.