4.9.4 SeRP peak plot
serp_plot
serp_plot draws compact SeRP enrichment profiles and called core peak regions for selected genes or transcripts after peak calling with serp_peak.
Function
Use this command when you want to:
- draw the enrichment profile (IP/control ratio) of one or a few transcripts;
- overlay the called core peak regions on the enrichment curve;
- mark the reported maximum-enrichment site of each called peak;
- compare the enrichment profiles of a target list with identical figure styling;
- generate publication-ready PDF or PNG figures at a custom resolution.
Input
The input is the output prefix previously used by serp_peak. The command reads two files:
| File | Description |
|---|---|
<prefix>_peaks.log |
Peak table written by serp_peak, used to resolve transcript IDs and called peak regions. |
<prefix>_peaks_ratio.txt |
Smoothed per-codon enrichment-ratio table, used as the plotting profile. |
Targets are given either directly or through a target list:
| Input | Description |
|---|---|
-g |
One transcript ID or gene name. |
--target-list |
A text table; the first non-empty column is used as the target set. Lines starting with # are ignored. |
A gene name is resolved to all matching transcript rows in the peak table; a transcript ID is matched directly. Targets that are neither a transcript ID nor a gene name are still kept and reported as missing profiles if no data is found.
Parameters
| Parameter | Required | Meaning |
|---|---|---|
-i |
yes | Input prefix previously used by serp_peak. The plotter reads <prefix>_peaks.log and <prefix>_peaks_ratio.txt. |
-g, --target |
yes* | One transcript ID or gene name to plot. Mutually exclusive with --target-list. |
--target-list |
yes* | Target list file; the first non-empty column is used. Mutually exclusive with -g. |
-o |
no | Optional output prefix; defaults to the serp_peak input prefix. |
--output-format |
no | Figure output format: pdf, png, or both. Default: pdf. |
--threshold |
no | Optional peak-threshold reference line. Set this to the same --enrich value used by serp_peak; it is not inferred automatically. |
--show-max-site |
no | Mark the reported maximum-enrichment site of each called peak. Boolean switch; pass --no-show-max-site to disable. Default: True. |
--shade-utr |
no | Use a subtle background to distinguish 5-prime and 3-prime UTRs. Boolean switch; pass --no-shade-utr to disable. Default: True. |
--y-max |
no | Optional fixed y-axis maximum. Must be > 0 when provided. |
--font-size |
no | Base figure font size. Default: 9.0. |
--dpi |
no | PNG output resolution. Default: 300. |
Output
Figures are written to a <output>_figures directory. Each resolved target transcript is drawn as one figure named after its transcript ID (/, \, :, and spaces replaced by _). The extension is determined by --output-format.
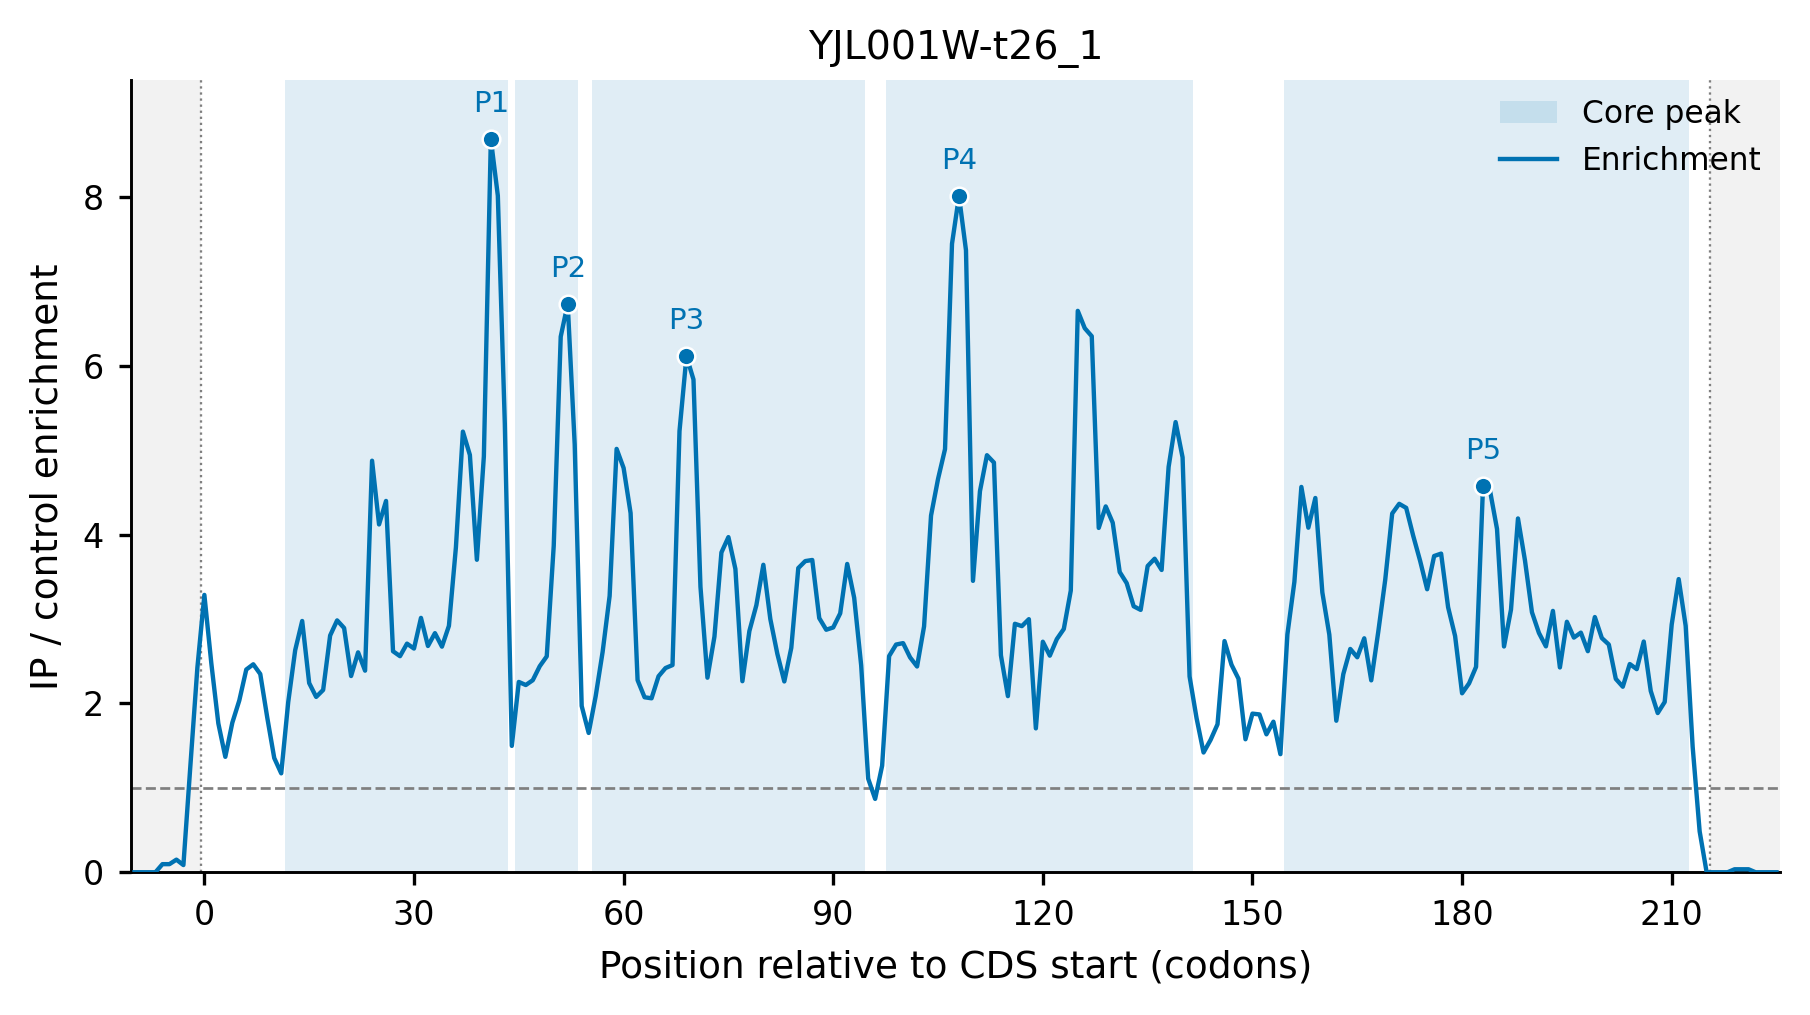
Each figure contains:
- a blue enrichment curve (
IP / control enrichment) across codon positions relative to the CDS start; - called core peak regions shaded behind the curve;
- the reported maximum-enrichment site of each peak marked with a dot and a
P1,P2, ... label (when--show-max-siteis enabled); - a dashed reference line at
1.0and, when--thresholdis given, a dotted peak-threshold line; - dotted CDS start/end guides and, when
--shade-utris enabled, a subtle background for 5-prime and 3-prime UTRs; - a title of
gene_name | transcriptwhen a gene name is annotated, or the transcript ID otherwise.
Examples
Draw a single transcript with the default settings:
Draw every target in a list with both PDF and PNG output and a custom prefix:
The figure below is the YJL001W-t26_1 transcript drawn by the command above. The transcript carries five called core peaks, whose maximum-enrichment sites are labeled P1 to P5:
Add the peak-threshold reference line used during peak calling and fix the y-axis scale for comparable figures:
serp_plot \
  --target-list gene.list \
  -i ../24.serp/legacy/test \
  --threshold 2.0 \
  --y-max 12 \
  --output-format both \
  -o gene
Notes
- Run
serp_peakfirst;serp_plotonly reads the two files written by it. -gand--target-listare mutually exclusive, and one of them is required.--thresholdis a visual reference only. Use the same--enrichvalue as theserp_peakrun for consistency; it is not inferred automatically.- A transcript ID is resolved directly; a gene name is resolved to all transcript rows with that gene name in the peak table.
- Targets without profile data are reported in a warning, and the remaining targets are still drawn.
- The output prefix defaults to the
serp_peakinput prefix, so the figure directory is named<input>_figureswhen-ois omitted.