4.6.2 Frameshift detection
Purpose
rpf_Shift scans the merged frame-resolved RPF density file and detects in-gene reading-frame switches, i.e. positions where the ribosome occupancy abruptly changes from one codon frame to another. Such switches are the signature of programmed ribosomal frameshifting (PRF), but they can also arise from assembly/annotation artefacts, RNA editing, or read-mapping issues, so every candidate should be inspected manually.
The analysis is performed sample by sample in five steps:
- Filtering – keep transcripts with enough RPF density (
--min) and trim a given number of codons after the TIS (--tis) and before the TTS (--tts). - Pre-scan – require a minimum 3-nt periodicity in the upstream region (
--pre-period) so that only translated transcripts are scanned. - Change-point scan – for every eligible transcript, walk along the CDS with a codon step (
--scan-step), test each position for a significant frame switch, and record the best split site. - Candidate calling – keep switches that satisfy the minimal effect size (
--min-shift), minimal segment length (--min-segment) and RPF count (--min-segment-reads), and a significance threshold on the FDR (--alpha). - Visualization – export a classification-count barplot, an effect-size vs significance scatter, and one figure per candidate transcript (
--gene-fig).
Step 1: Run rpf_Shift
The input is the merged frame-resolved density file produced by rpf_Merge (see 4.5.5 Merge density).
1.1 Parameters
| Parameter | Required | Description |
|---|---|---|
-r, --rpf |
Yes | Input merged frame-resolved RPF density file (JSONL/JSONL.GZ/TXT). |
-o, --output |
Yes | Output prefix. |
-t, --transcript |
No | Optional transcript filter table (TXT). |
-m, --min |
No | Minimum CDS RPF count required for a transcript to be scanned. Default 50. |
--tis |
No | Number of CDS codons discarded after the translation initiation site (TIS). Default 10. |
--tts |
No | Number of CDS codons discarded before the translation termination site (TTS). Default 5. |
-s, --site |
No | Ribosomal site used for the frame-density analysis. Choices E, P, A. Default P. |
--pre-period |
No | Minimum percentage of reads in frame 0 used in the pre-scan filter. Default 45.0. |
-p, --period |
No | Minimum percentage of reads expected in the shifted frame after the change point. Default 45.0. |
--min-shift |
No | Minimum increase of the shifted-frame proportion at a change point. Default 0.15. |
--min-segment |
No | Minimum number of codon positions required on each side of a change point. Default 20. |
--min-segment-reads |
No | Minimum total RPF count required on each side of a change point. Default 20.0. |
--scan-step |
No | Codon step between candidate change points. Default 1. |
--alpha |
No | Maximum adjusted significance value (FDR) accepted for a candidate. Default 0.05. |
--thread |
No | Number of sample-level worker threads. Default 1. |
--remove-outlier |
No | Remove isolated extreme density pile-ups before scanning (recommended). Disabled by default. |
--outlier-iqr |
No | IQR multiplier used for the global pile-up detection. Default 8.0. |
--outlier-window |
No | Number of neighboring codons used for local outlier confirmation. Default 5. |
--outlier-local-fold |
No | Minimum fold over the local background required for outlier removal. Default 10.0. |
--smooth-window |
No | Centered codon window used for the candidate profile plots. Default 5. |
--plot-bin-size |
No | Codon bin size used for the stacked frame-composition plots. Default 5. |
--gene-plot-mode |
No | Layout of the per-candidate figure. Choices bar, heatmap, both. Default both. |
--gene-fig |
No | Figure format of the per-candidate plots. Choices none, png, pdf, both. Default png. |
--max-gene-figures |
No | Maximum number of candidate figures written; use 0 for all. Default 500. |
1.2 Example
cd ./sce/4.ribo-seq/20.frame_shift/

rpf_Shift \
    -r ../05.merge/sce1_rpf_merged.jsonl.gz \
    -o sce \
    -s P \
    -m 50 \
    --tis 10 \
    --tts 5 \
    --pre-period 45 \
    --period 45 \
    --min-shift 0.15 \
    --min-segment 20 \
    --min-segment-reads 20 \
    --scan-step 1 \
    --alpha 0.05 \
    --thread 12 \
    --remove-outlier \
    --smooth-window 5 \
    --plot-bin-size 1 \
    --gene-fig png \
    --max-gene-figures 500 \
    &> sce_frame_shift.log
1.3 Output
All output files are written to the current working directory with the given prefix (sce in the example above).
| Output | Description |
|---|---|
<prefix>_gene_periodicity.txt |
Gene-level 3-nt periodicity table: per-transcript RPF counts and frame ratios (Sample, name, PositionCount, Frame0/1/2Count, Frame0/1/2Ratio). |
<prefix>_frame_shift_scan.txt |
Per-position statistics of the change-point scan, one row per tested sample–transcript pair, including the best split site and its p-value. |
<prefix>_frame_shift_candidates.txt |
Final frameshift candidates that passed all filters, one row per sample–transcript pair, with the shift site, direction (+1/-1), ShiftEffect, RawPValue, ScanAdjustedPValue and FDR. |
<prefix>_frame_shift_count.txt |
Candidate count per sample and classification (plus1_shift, minus1_shift, fuzzy, no_shift, insufficient). |
<prefix>_frame_shift.outliers.txt |
Outlier positions removed before the scan (Sample, name, now_nt, codon, TotalDensity, GlobalCutoff, ...). Only written with --remove-outlier. |
<prefix>_frame_shift.summary.json |
Machine-readable run summary: tool version, parameter settings, per-sample candidate counts and the list of output files. |
<prefix>_frame_shift_count_plot.pdf/.png |
Stacked barplot of the candidate count by classification, one bar per sample. |
<prefix>_frame_shift_scatter.pdf/.png |
Per-sample scatter of the frame-shift effect vs -log10(FDR) with candidates highlighted. |
<prefix>_frame_shift_geneplots/ |
Per-candidate gene figures (one PNG/PDF per sample–transcript pair) showing the frame-density profiles. |
Example output figures
1. Candidate count by shift type
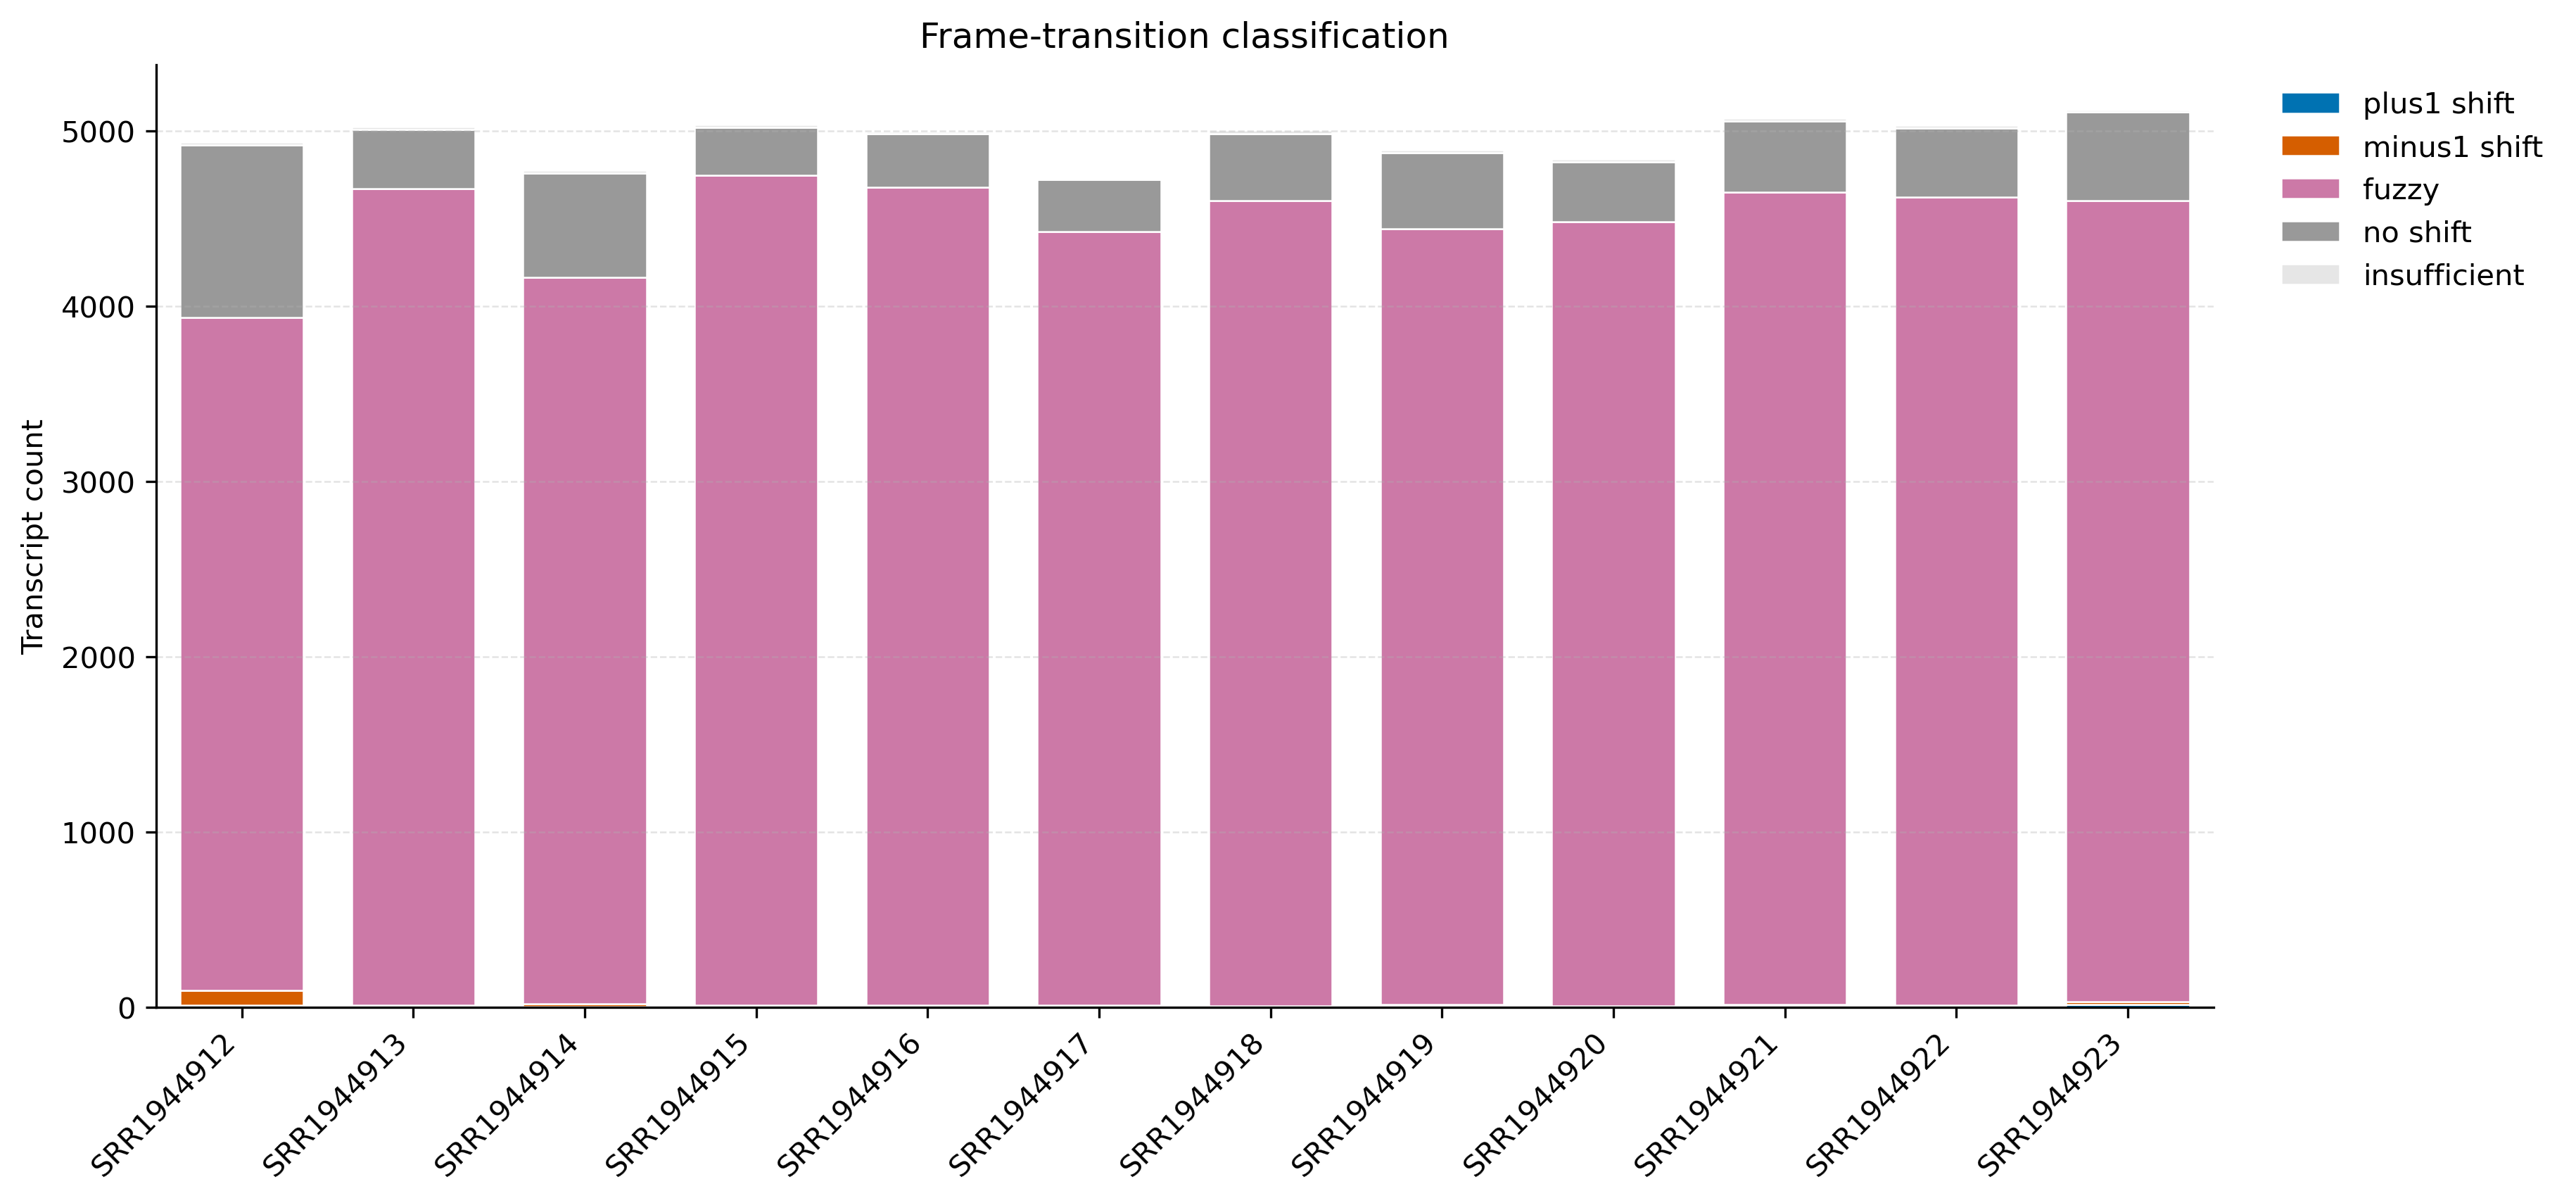
The stacked barplot summarizes, for every sample, how many transcripts were assigned to each class: plus1_shift, minus1_shift (significant candidates), fuzzy (a frame switch was detected but it is ambiguous or below the effect threshold), no_shift (no switch found), and insufficient (not enough reads/positions to test). In this dataset, the vast majority of transcripts are classified as fuzzy (~3,800–4,700 per sample) or no_shift (~270–990), while only 6–95 candidates per sample are significant. SRR1944912 stands out with 95 candidates (86 minus1_shift + 9 plus1_shift), far more than any other sample (6–31). This strongly suggests a systematic bias in that sample (e.g. read-length composition or P-site calibration) rather than real biological frameshifting; such samples should be quality-checked before biological interpretation.
2. Effect-size vs significance scatter
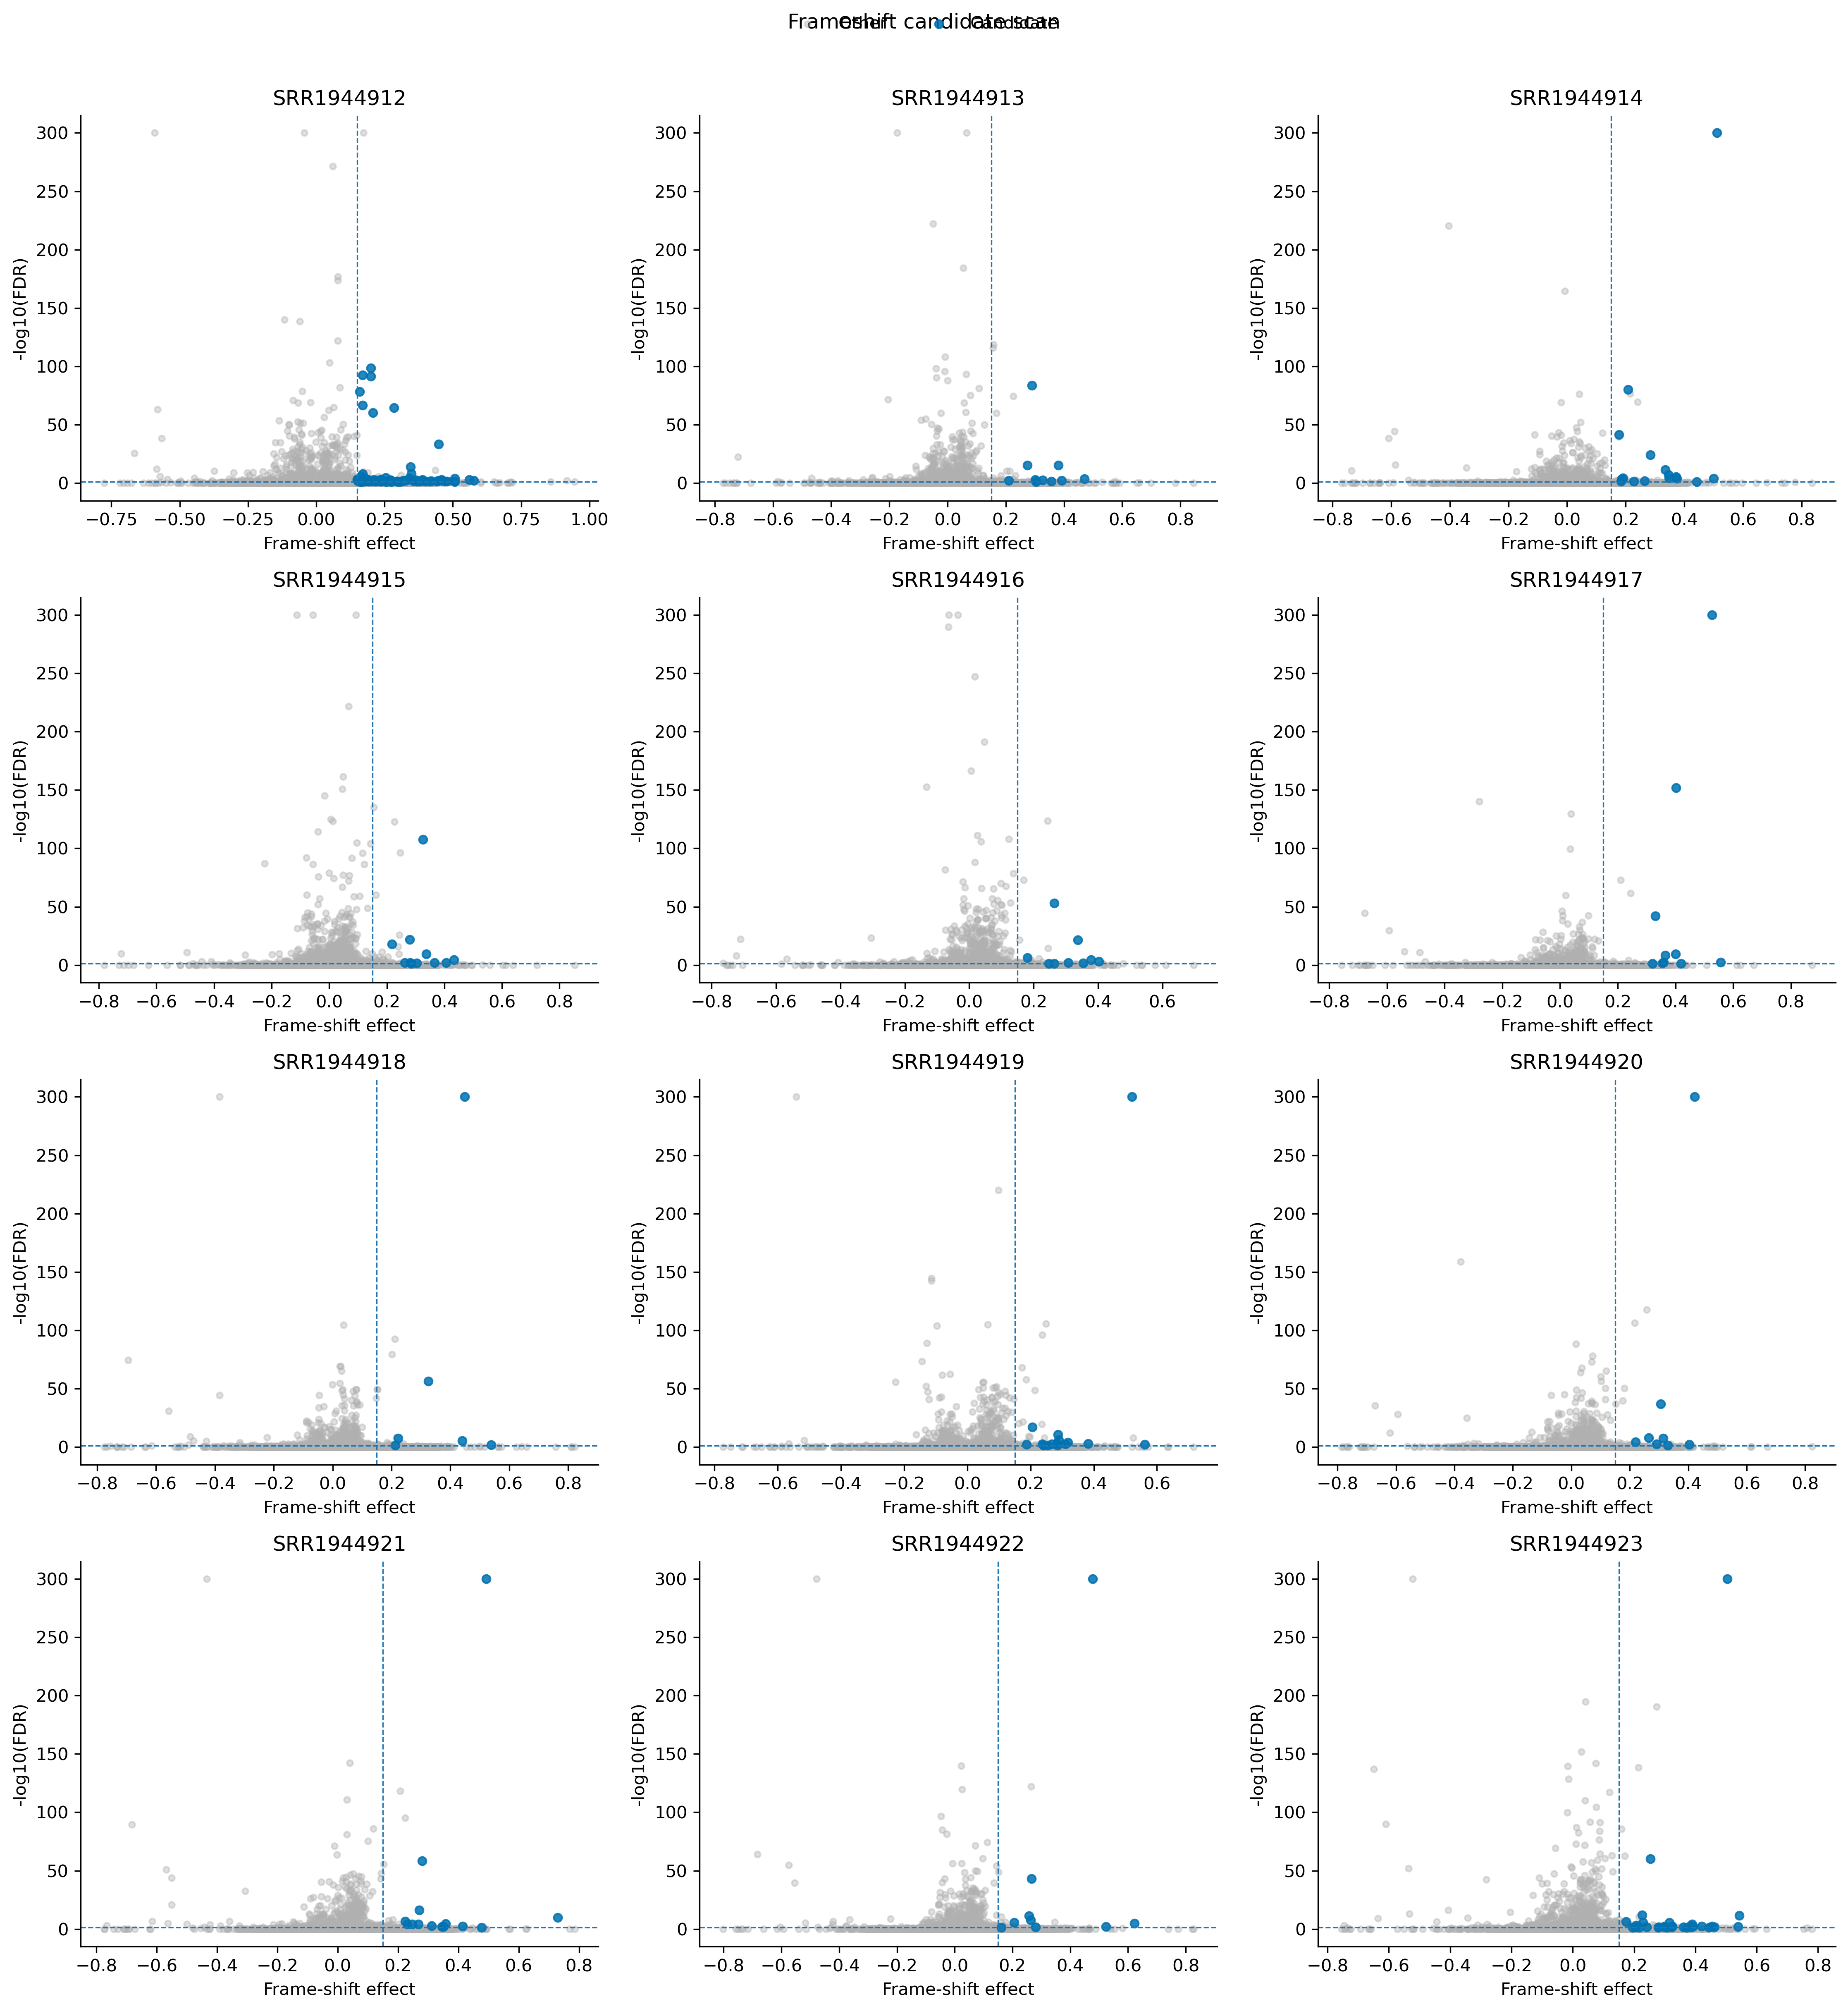
Each panel corresponds to one sample. The x-axis is the frame-shift effect (increase of the shifted-frame proportion at the change point) and the y-axis is -log10(FDR); the dashed lines mark the --min-shift (0.15) and --alpha (0.05) thresholds. Candidates (plus1_shift/minus1_shift) are highlighted in blue and sit in the upper-right region (effect > 0.15 and FDR < 0.05), whereas non-significant switches stay grey in the lower-left region. The plot is a quick way to see how strongly the effect size and significance co-vary per sample.
3. Per-candidate gene plot (YOR202W, HIS3)
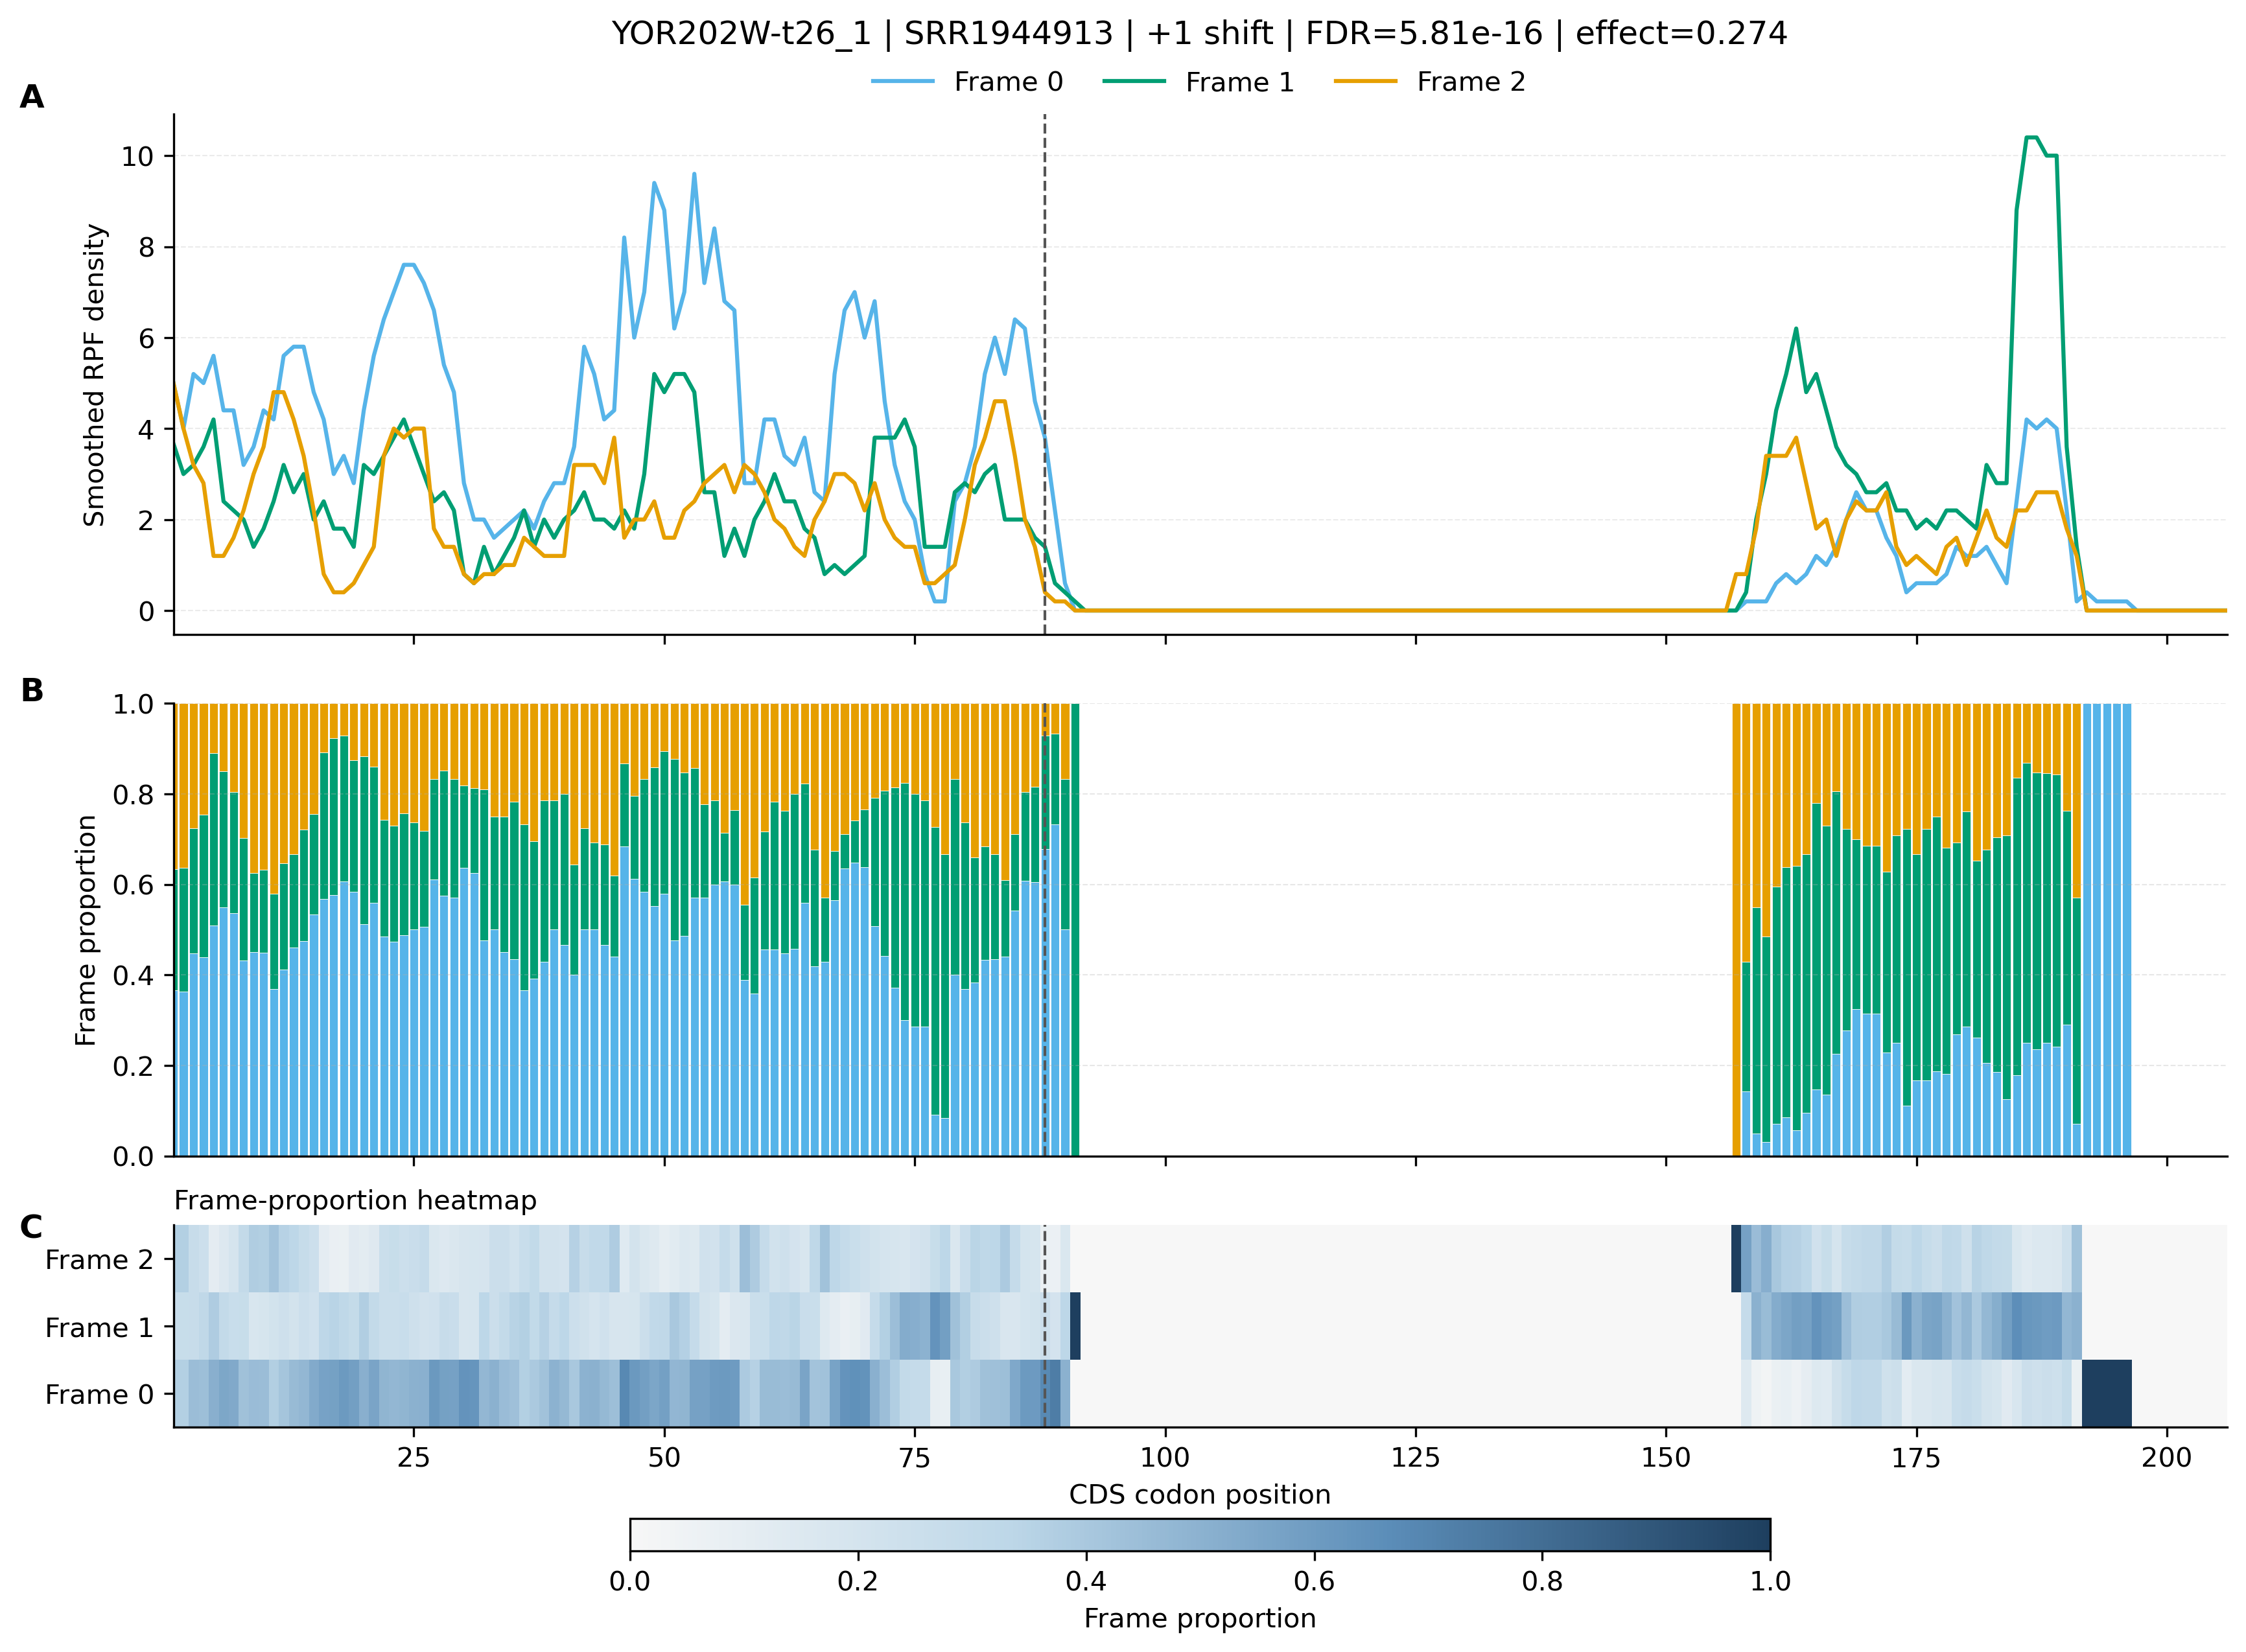
For every candidate, rpf_Shift writes a three-panel figure: (A) smoothed RPF density of the three reading frames along the CDS, (B) a 100% stacked barplot of the frame composition (bin size = --plot-bin-size), and (C) a heatmap of the frame proportion. The vertical dashed line marks the detected shift site. The title reports the transcript, sample, shift direction, FDR and effect. Here YOR202W (HIS3) is called as a +1 shift in SRR1944913: before the change point (codon ~167) almost all reads are in frame 0, while downstream the occupancy switches to frame +1, with a highly significant adjusted p-value (FDR = 5.8e-16). Because the same +1 switch is recovered in many other samples of this dataset, this is a reproducible candidate worth biological follow-up (e.g. manual inspection of the read alignments around the site).
Notes
- The classification
fuzzyrefers to change points that are detected but do not reach the effect or FDR thresholds; increasing--min-shiftor lowering--alphawill make the calling more stringent. --remove-outlieris recommended: without it, single high-coverage pile-ups (e.g. RT-stops or mis-mapped reads) can create spurious "switches".rpf_Shiftexpects a frame-resolved density file (each position split by the P-site frame). If the input was generated with--offset-modeother than P-site, set-saccordingly so the frames are consistent.- For follow-up analyses (e.g. comparing shift sites across samples), the
ScanAdjustedPValueandFDRcolumns of_frame_shift_candidates.txtalready account for multiple testing.