4.9.5 SeRP metaplot
serp_metaplot
serp_metaplot builds one normalized TIS/TTS metagene profile per sample, calculates matched IP/control enrichment between sample metaprofiles, and summarizes the enrichment across biological replicate pairs.
Function
Use this command when you want to:
- draw a TIS/TTS metaplot of SeRP enrichment aggregated over a common transcript set;
- inspect the average IP/control enrichment profile around the start codon and the stop codon;
- show matched biological-replicate enrichment curves behind the aggregate curve;
- compare the same transcript set between control and IP samples with equal sample sizes.
Input
The input is an RPF density file and two comma-separated sample groups:
| Input | Description |
|---|---|
-r |
RPF density TXT, JSON, JSONL, or compressed JSON density file. |
--ck |
Comma-separated control sample names. Sample order defines biological replicate pairing with --ip. |
--ip |
Comma-separated IP sample names. Sample order defines biological replicate pairing with --ck. |
--ck and --ip must contain equal numbers of samples so that the k-th control sample is paired with the k-th IP sample as one biological replicate pair.
The workflow first builds one normalized TIS/TTS metagene profile per sample from a common transcript set, then calculates matched IP/control enrichment between the sample metaprofiles, and finally aggregates the enrichment across replicate pairs (sample_metaplot_then_matched_ratio). This differs from a transcript-first ratio workflow where IP/control ratios are calculated per transcript before aggregation.
Parameters
| Parameter | Required | Meaning |
|---|---|---|
-r, --rpf |
yes | Input RPF density TXT, JSON, JSONL, or compressed JSON density file. |
--ck |
yes | Comma-separated control sample names; order defines replicate pairing with --ip. |
--ip |
yes | Comma-separated IP sample names; order defines replicate pairing with --ck. |
-o, --output |
yes | Output file prefix. |
-n, --norm |
no | Optional two-column file containing sample-level total RPF counts. Defaults to the totals read from the RPF density file. |
--label |
no | Optional comparison label shown above the metaplot figure. Defaults to IP / control sample lists. |
-m, --min |
no | Minimum gene-level CDS RPF count required in every control/IP sample. Default: 50. |
--scale |
no | Normalization scale used to calculate sample-level RPM-like density. Default: 1000000.0. |
--window |
no | Centered rolling-sum window in codons applied to sample metaprofiles before matched IP/control ratio calculation. Default: 5. |
--pseudocount |
no | Normalized-density pseudocount used for sample-metaprofile ratios. Default: 0.1. |
--aggregate |
no | Statistic used to combine enrichment curves across replicate pairs: median or mean. Default: median. |
--tis |
no | Number of CDS codons displayed from the start codon (0 to TIS-1). Default: 150. |
--tts |
no | Number of CDS codons displayed before and including the stop codon. Default: 150. |
--detail |
no | Write the per-transcript normalized sample densities used to build sample metaprofiles as gzip-compressed text. Default: False. |
--show-replicates |
no | Show matched biological-replicate enrichment curves behind the aggregate curve. Boolean switch; pass --no-show-replicates to disable. Default: True. |
--output-format |
no | Metaplot figure output format: pdf, png, or both. Default: pdf. |
--font-size |
no | Base figure font size. Default: 9.0. |
--dpi |
no | PNG output resolution. Default: 300. |
Output
All output files share the prefix given by -o. The aggregate enrichment table and the run summary are always written; the per-transcript detail file is written only when --detail is enabled.
| File | Description |
|---|---|
<output>.metaplot.txt |
Aggregate TIS/TTS enrichment per position: meta, position, gene_number, pair_number, enrichment, mean_enrichment, median_enrichment, min_enrichment, max_enrichment, q25_enrichment, q75_enrichment. |
<output>.metaplot_pair.txt |
Matched replicate-pair enrichment per position: meta, position, pair, control_sample, ip_sample, enrichment. |
<output>.metaplot_sample.txt |
Per-sample metaprofile density per position: meta, position, sample, gene_number, meta_density. |
<output>.metaplot_summary.txt |
Run summary as metric / value pairs (input file, sample groups, replicate pairs, label, transcript counts, filter and enrichment parameters). |
<output>.metaplot_gene.txt.gz |
Per-transcript normalized sample densities (gzip-compressed). Written only when --detail is enabled. |
<output>.metaplot.<ext> |
Combined TIS/TTS enrichment figure, where <ext> is determined by --output-format. |
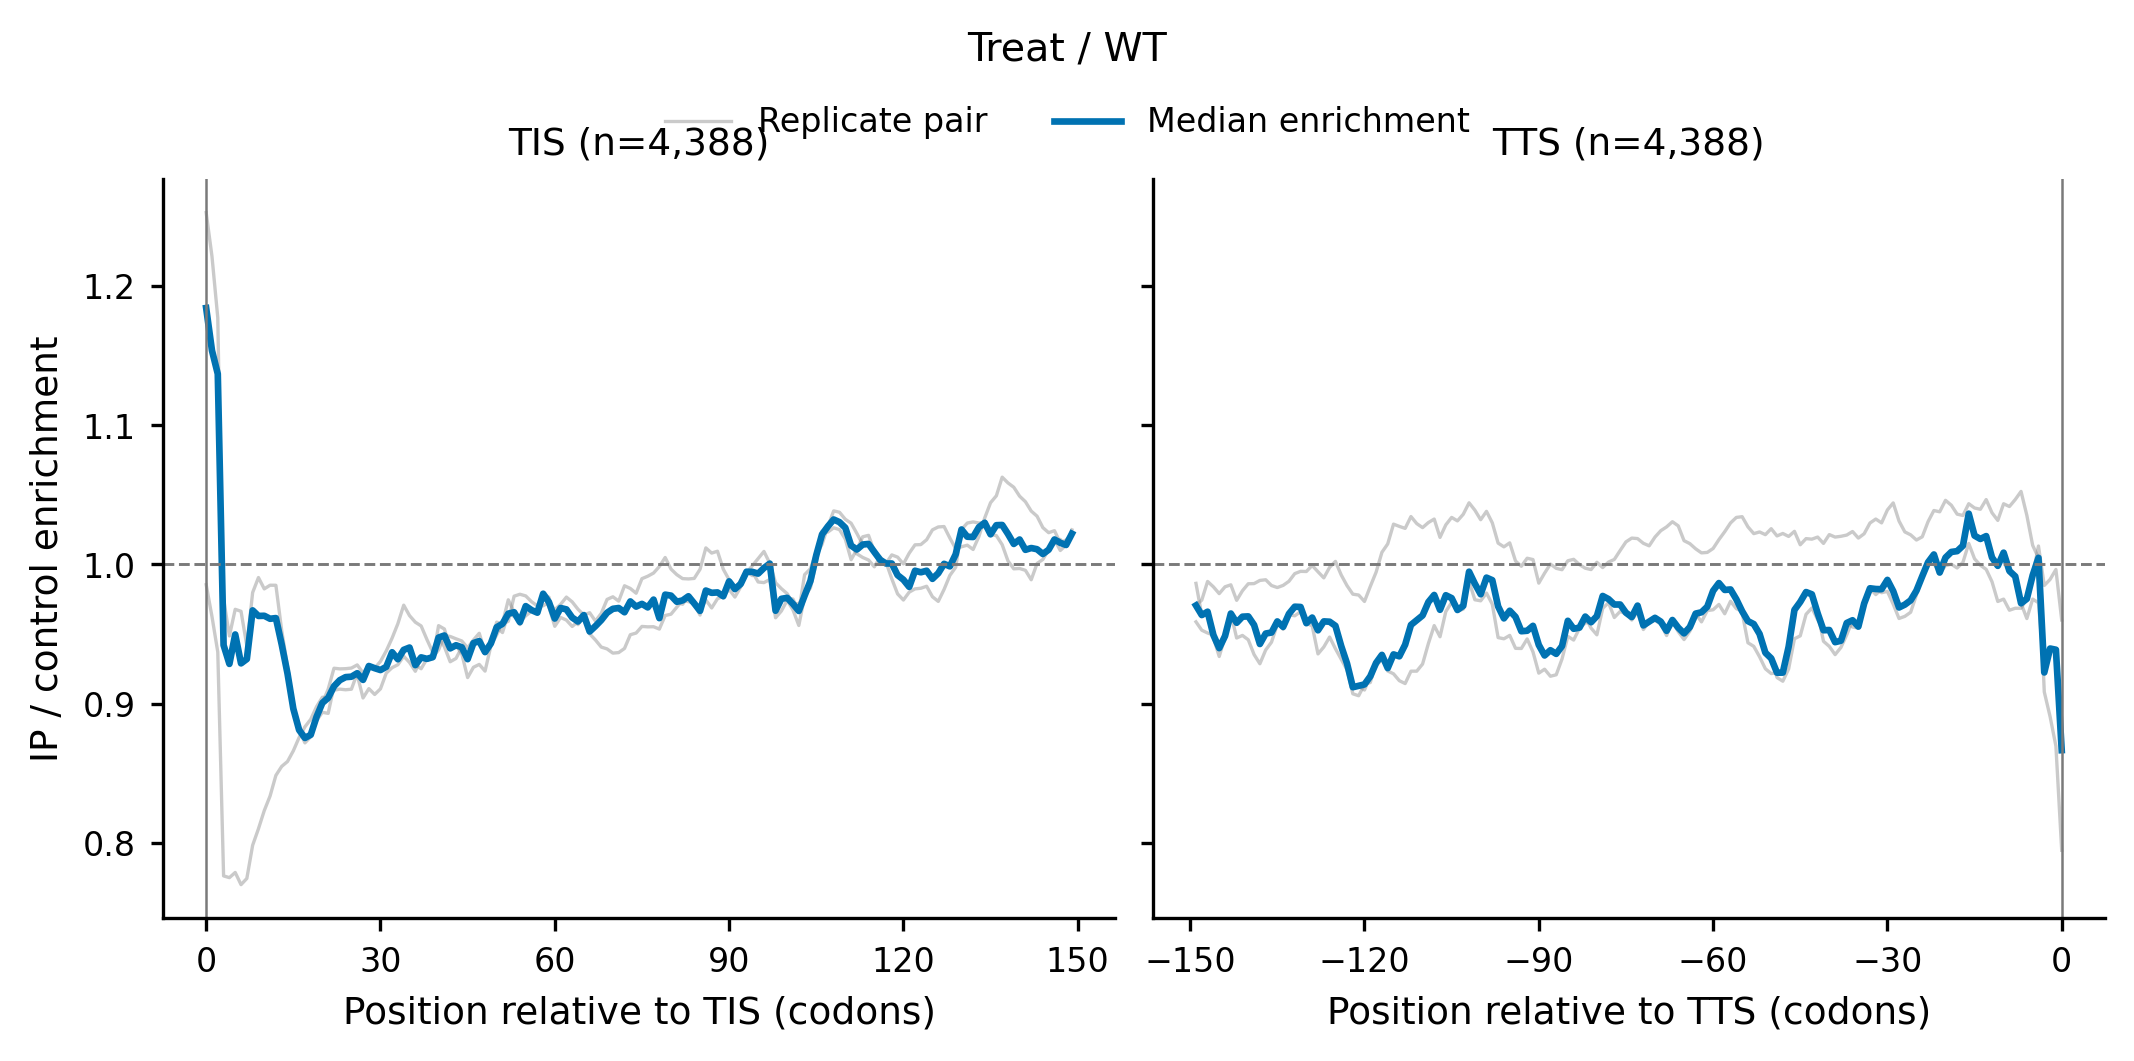
The figure shows two panels. The left panel is the TIS metaplot and the right panel is the TTS metaplot. Each panel contains:
- thin gray curves for the matched biological-replicate pairs (when
--show-replicatesis enabled); - a blue curve for the aggregate enrichment across replicate pairs;
- a dashed reference line at
1.0and a vertical guide at position0(the start codon for TIS, the stop codon for TTS); - a title of the form
TIS (n=4,388)orTTS (n=4,388)reporting the retained transcript number; - the comparison label from
--labelshown above the two panels.
Examples
Draw TIS/TTS enrichment metaplots from a compressed JSON density file with matched control/IP samples and both PDF and PNG output:
serp_metaplot \
  -r ../05.merge/sce_rpf_merged.jsonl.gz \
  --ck SRR1944912,SRR1944913,SRR1944914 \
  --ip SRR1944921,SRR1944922,SRR1944923 \
  --tis 150 \
  --tts 150 \
  --label "Treat / WT" \
  --output-format both \
  -o test
The figure below was generated by the command above. In this run, 4,388 transcripts passed the sample-level RPF filter and the complete TIS/TTS window requirements:
Summarize the enrichment with the mean across replicate pairs and hide the per-pair curves:
serp_metaplot \
  -r sce_rpf_merged.jsonl.gz \
  --ck SRR1944912,SRR1944913,SRR1944914 \
  --ip SRR1944921,SRR1944922,SRR1944923 \
  --aggregate mean \
  --no-show-replicates \
  --output-format png \
  -o test
Notes
--ckand--ipmust contain equal numbers of samples and no duplicated names. The k-th control sample is paired with the k-th IP sample.- All samples use the same retained transcript set: transcripts must pass the sample-level RPF filter in every control/IP sample and cover the complete TIS/TTS windows.
- Enrichment is calculated from sample metaprofiles first, then aggregated across replicate pairs (
sample_metaplot_then_matched_ratio). --windowis a centered rolling-sum window applied before ratio calculation; use a value compatible with the enrichment window used elsewhere in the SeRP workflow.--labelonly affects the figure title; it does not change the calculation.- When no transcripts pass both the RPF filter and the window requirements, the workflow stops with a suggestion to reduce
--min,--tis, or--tts.