4.5.6 Periodicity
Purpose
Calculate the 3-nt periodicity from a merged RPF density file and optionally merge periodicity tables from multiple samples or analyses. Strong 3-nt periodicity is a key Ribo-seq quality-control signal and should be checked before codon-level analysis.
rpf_Periodicity    # Calculate frame-specific counts/ratios and draw periodicity plots
merge_period       # Merge *_periodicity.txt tables from multiple samples or analyses
Both current JSONL density files and the legacy TXT density files are supported. The workflow assigns each RPF read to one of the three reading frames (0/1/2), computes per-sample counts and ratios, draws per-sample barplots plus a stacked summary plot, and can merge the resulting tables across samples.
Step 1: Run rpf_Periodicity
Calculate the frame-specific RPF distribution from a merged density file.
1.1 Parameters
| Parameter | Required | Description |
|---|---|---|
-r, --rpf |
Yes | Input RPF density file in JSONL or TXT format, usually the merged density file generated by rpf_Merge. |
-o, --output |
Yes | Output prefix. Output files are <prefix>_periodicity.txt and <prefix>_*_periodicity_plot.pdf/.png. |
-t, --transcript |
No | Optional transcript filter table in TXT format. When provided, only the listed transcripts are retained. |
-m, --min |
No | Retain transcripts with more than this minimum total RPF count. Default is 50. |
--tis |
No | Number of codons after the translation initiation site (TIS) to discard. Default is 0. |
--tts |
No | Number of codons before the translation termination site (TTS) to discard. Default is 0. |
1.2 Example
cd ./sce/4.ribo-seq/06.periodicity/

rpf_Periodicity \
    -r ../05.merge/sce_rpf_merged.jsonl.gz \
    -m 30 \
    --tis 15 \
    --tts 10 \
    -o sce \
    &> sce.log
1.3 Output
| Output | Description |
|---|---|
<prefix>_periodicity.txt |
Tab-delimited table with one row per sample and reading frame: Sample, Frame, Count, Ratio (%). |
<prefix>_count_periodicity_plot.pdf / .png |
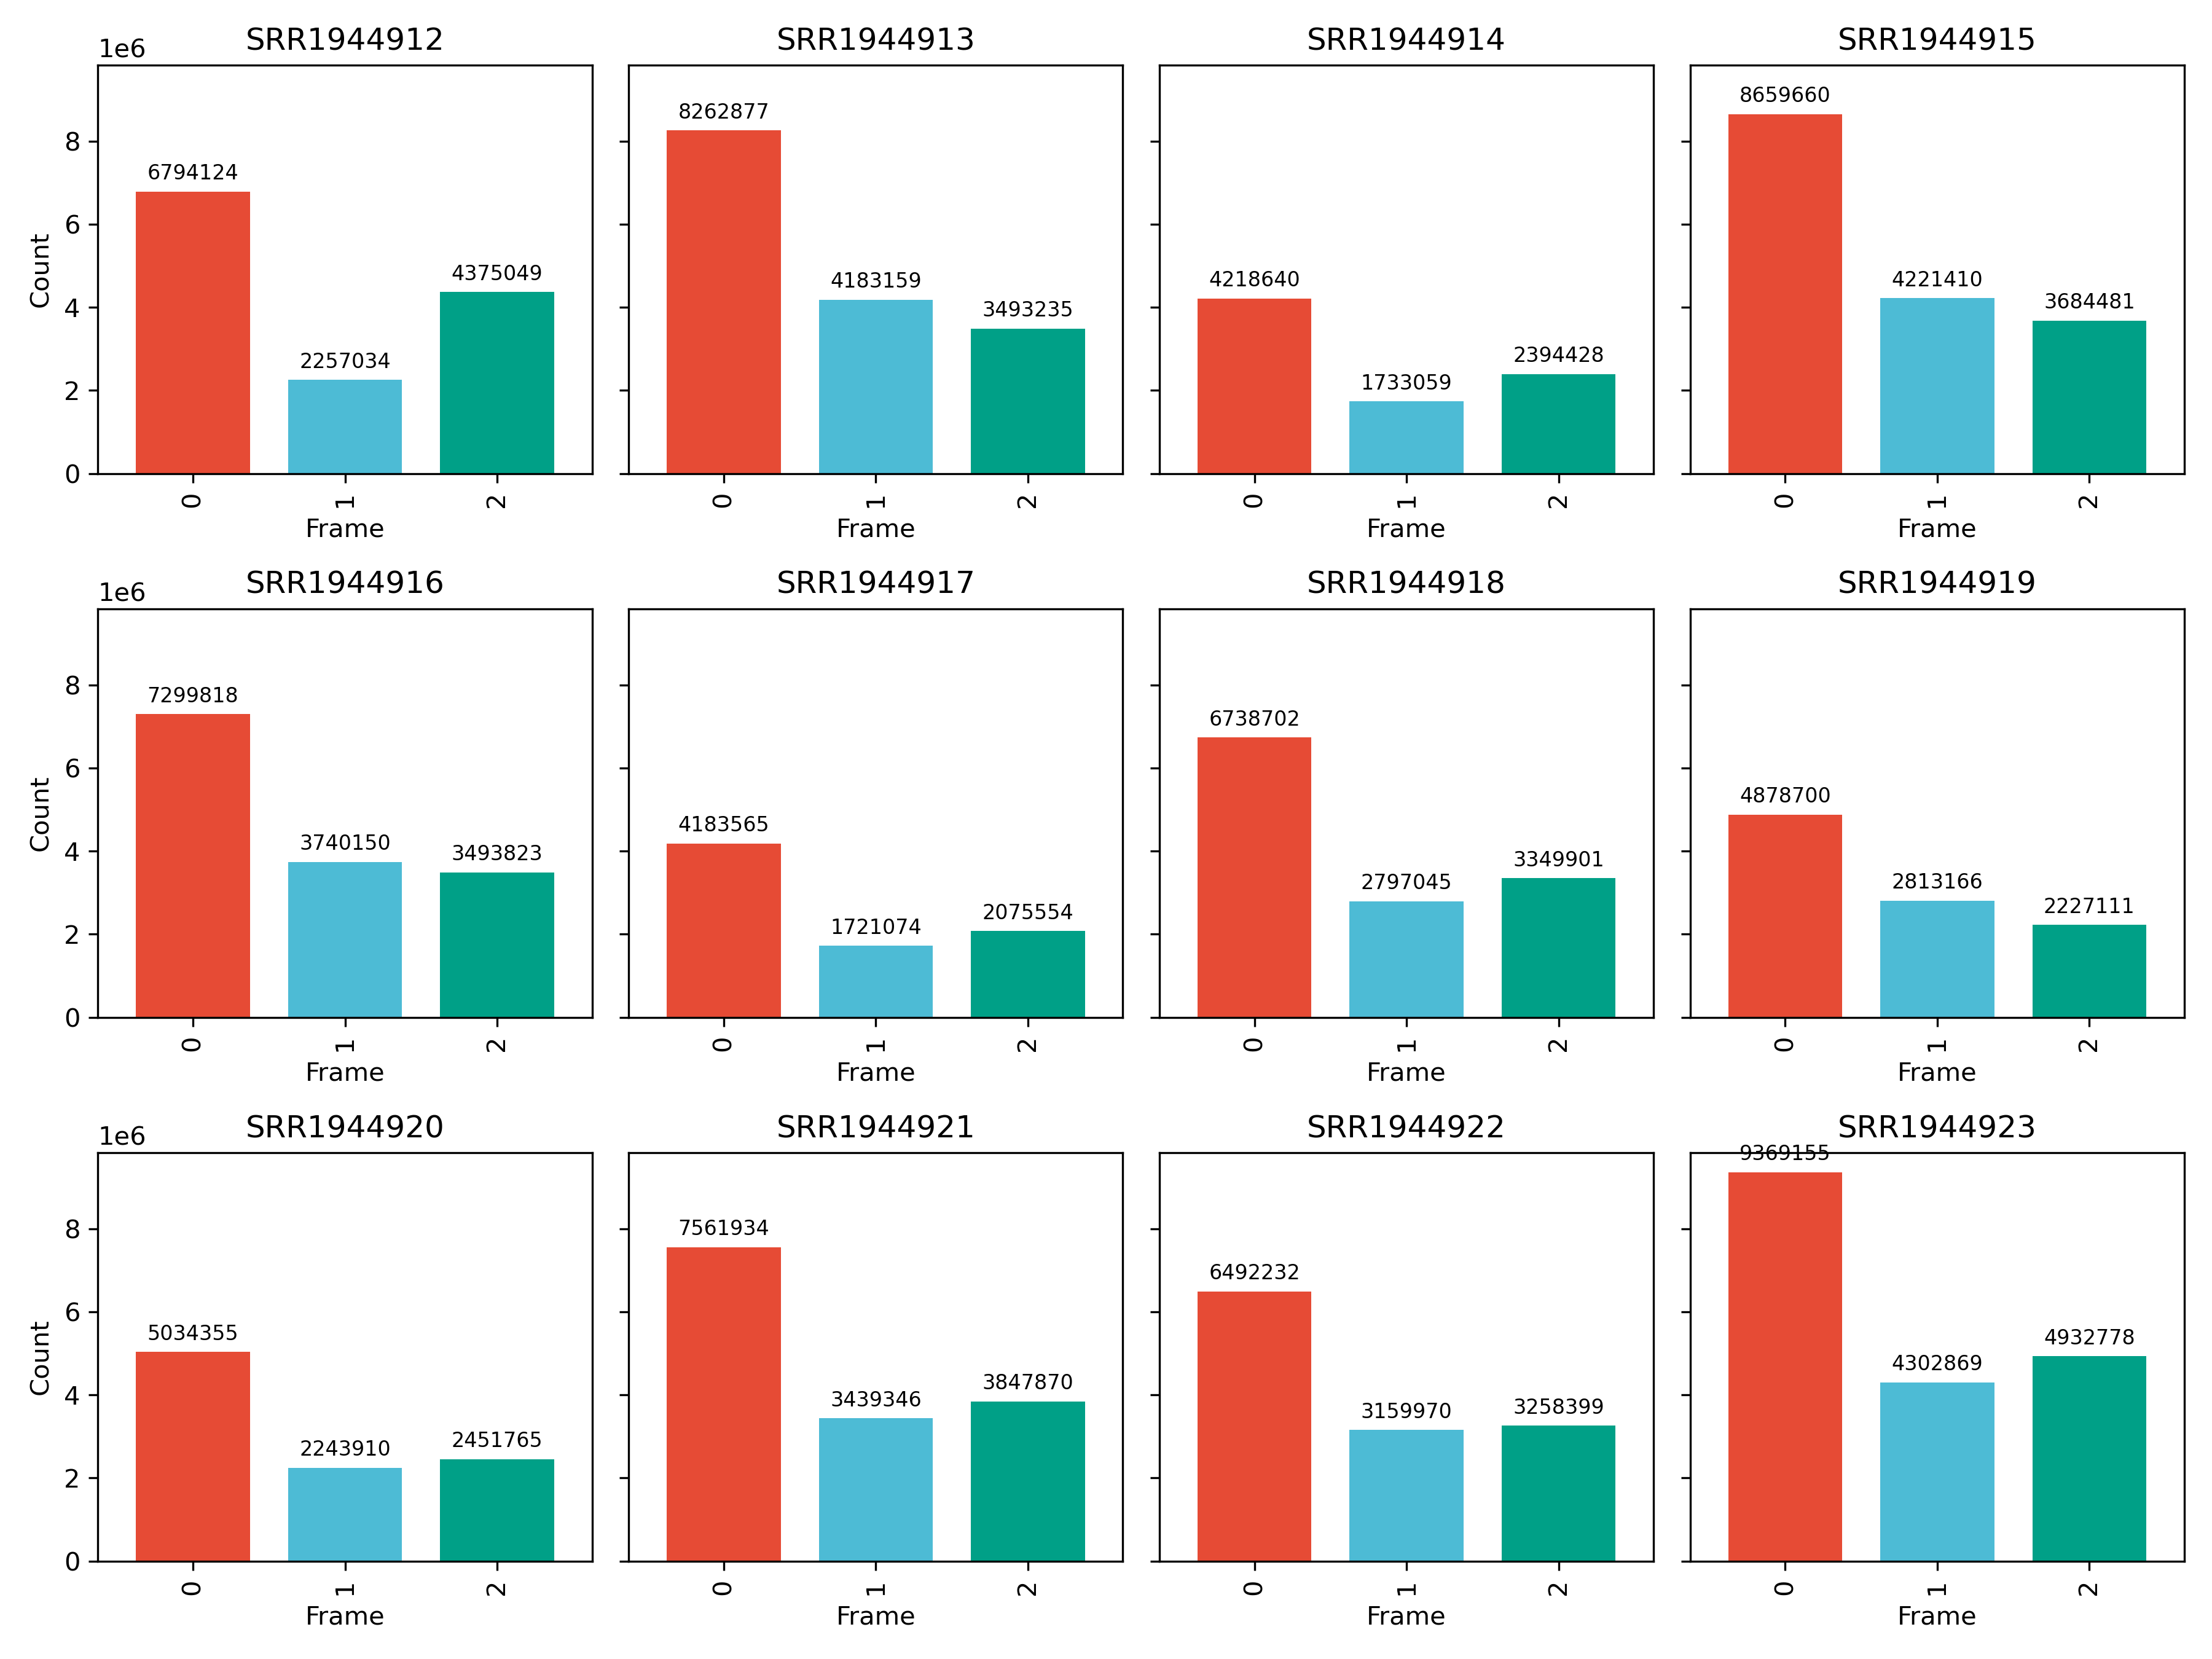
Per-sample barplot of frame-specific RPF counts. |
<prefix>_ratio_periodicity_plot.pdf / .png |
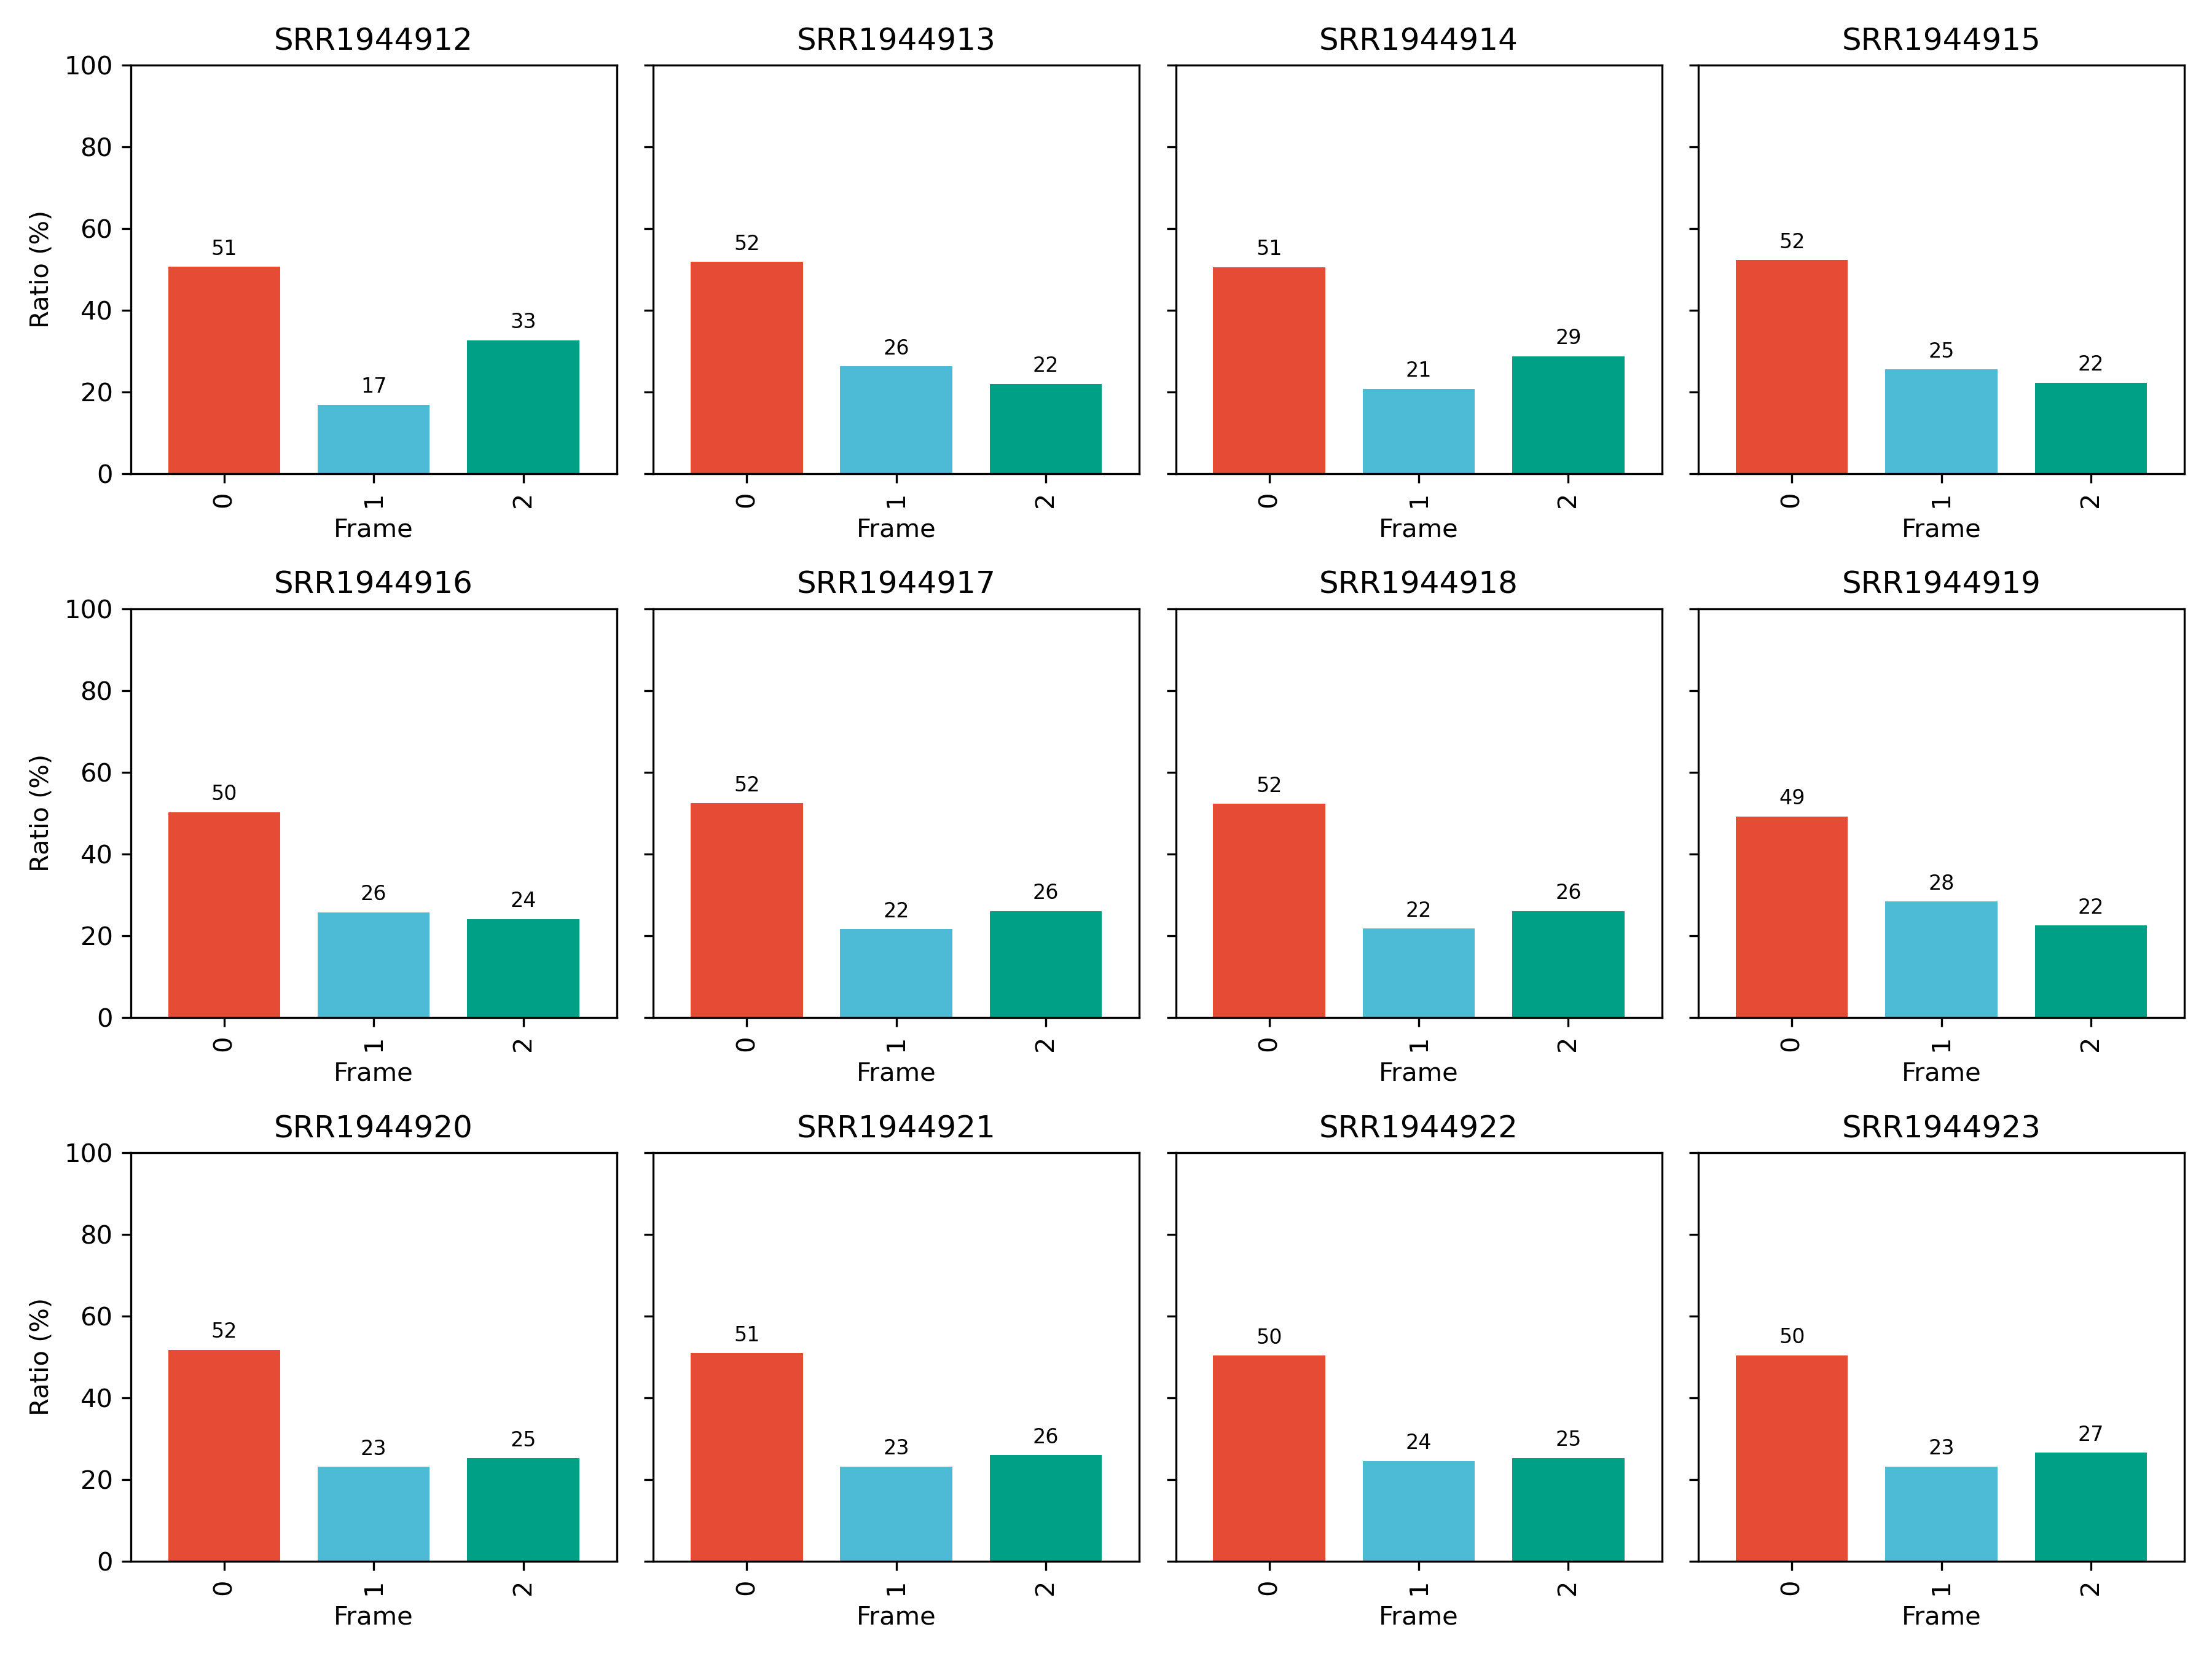
Per-sample barplot of frame-specific RPF ratios (%). |
<prefix>_stacked_periodicity_plot.pdf / .png |
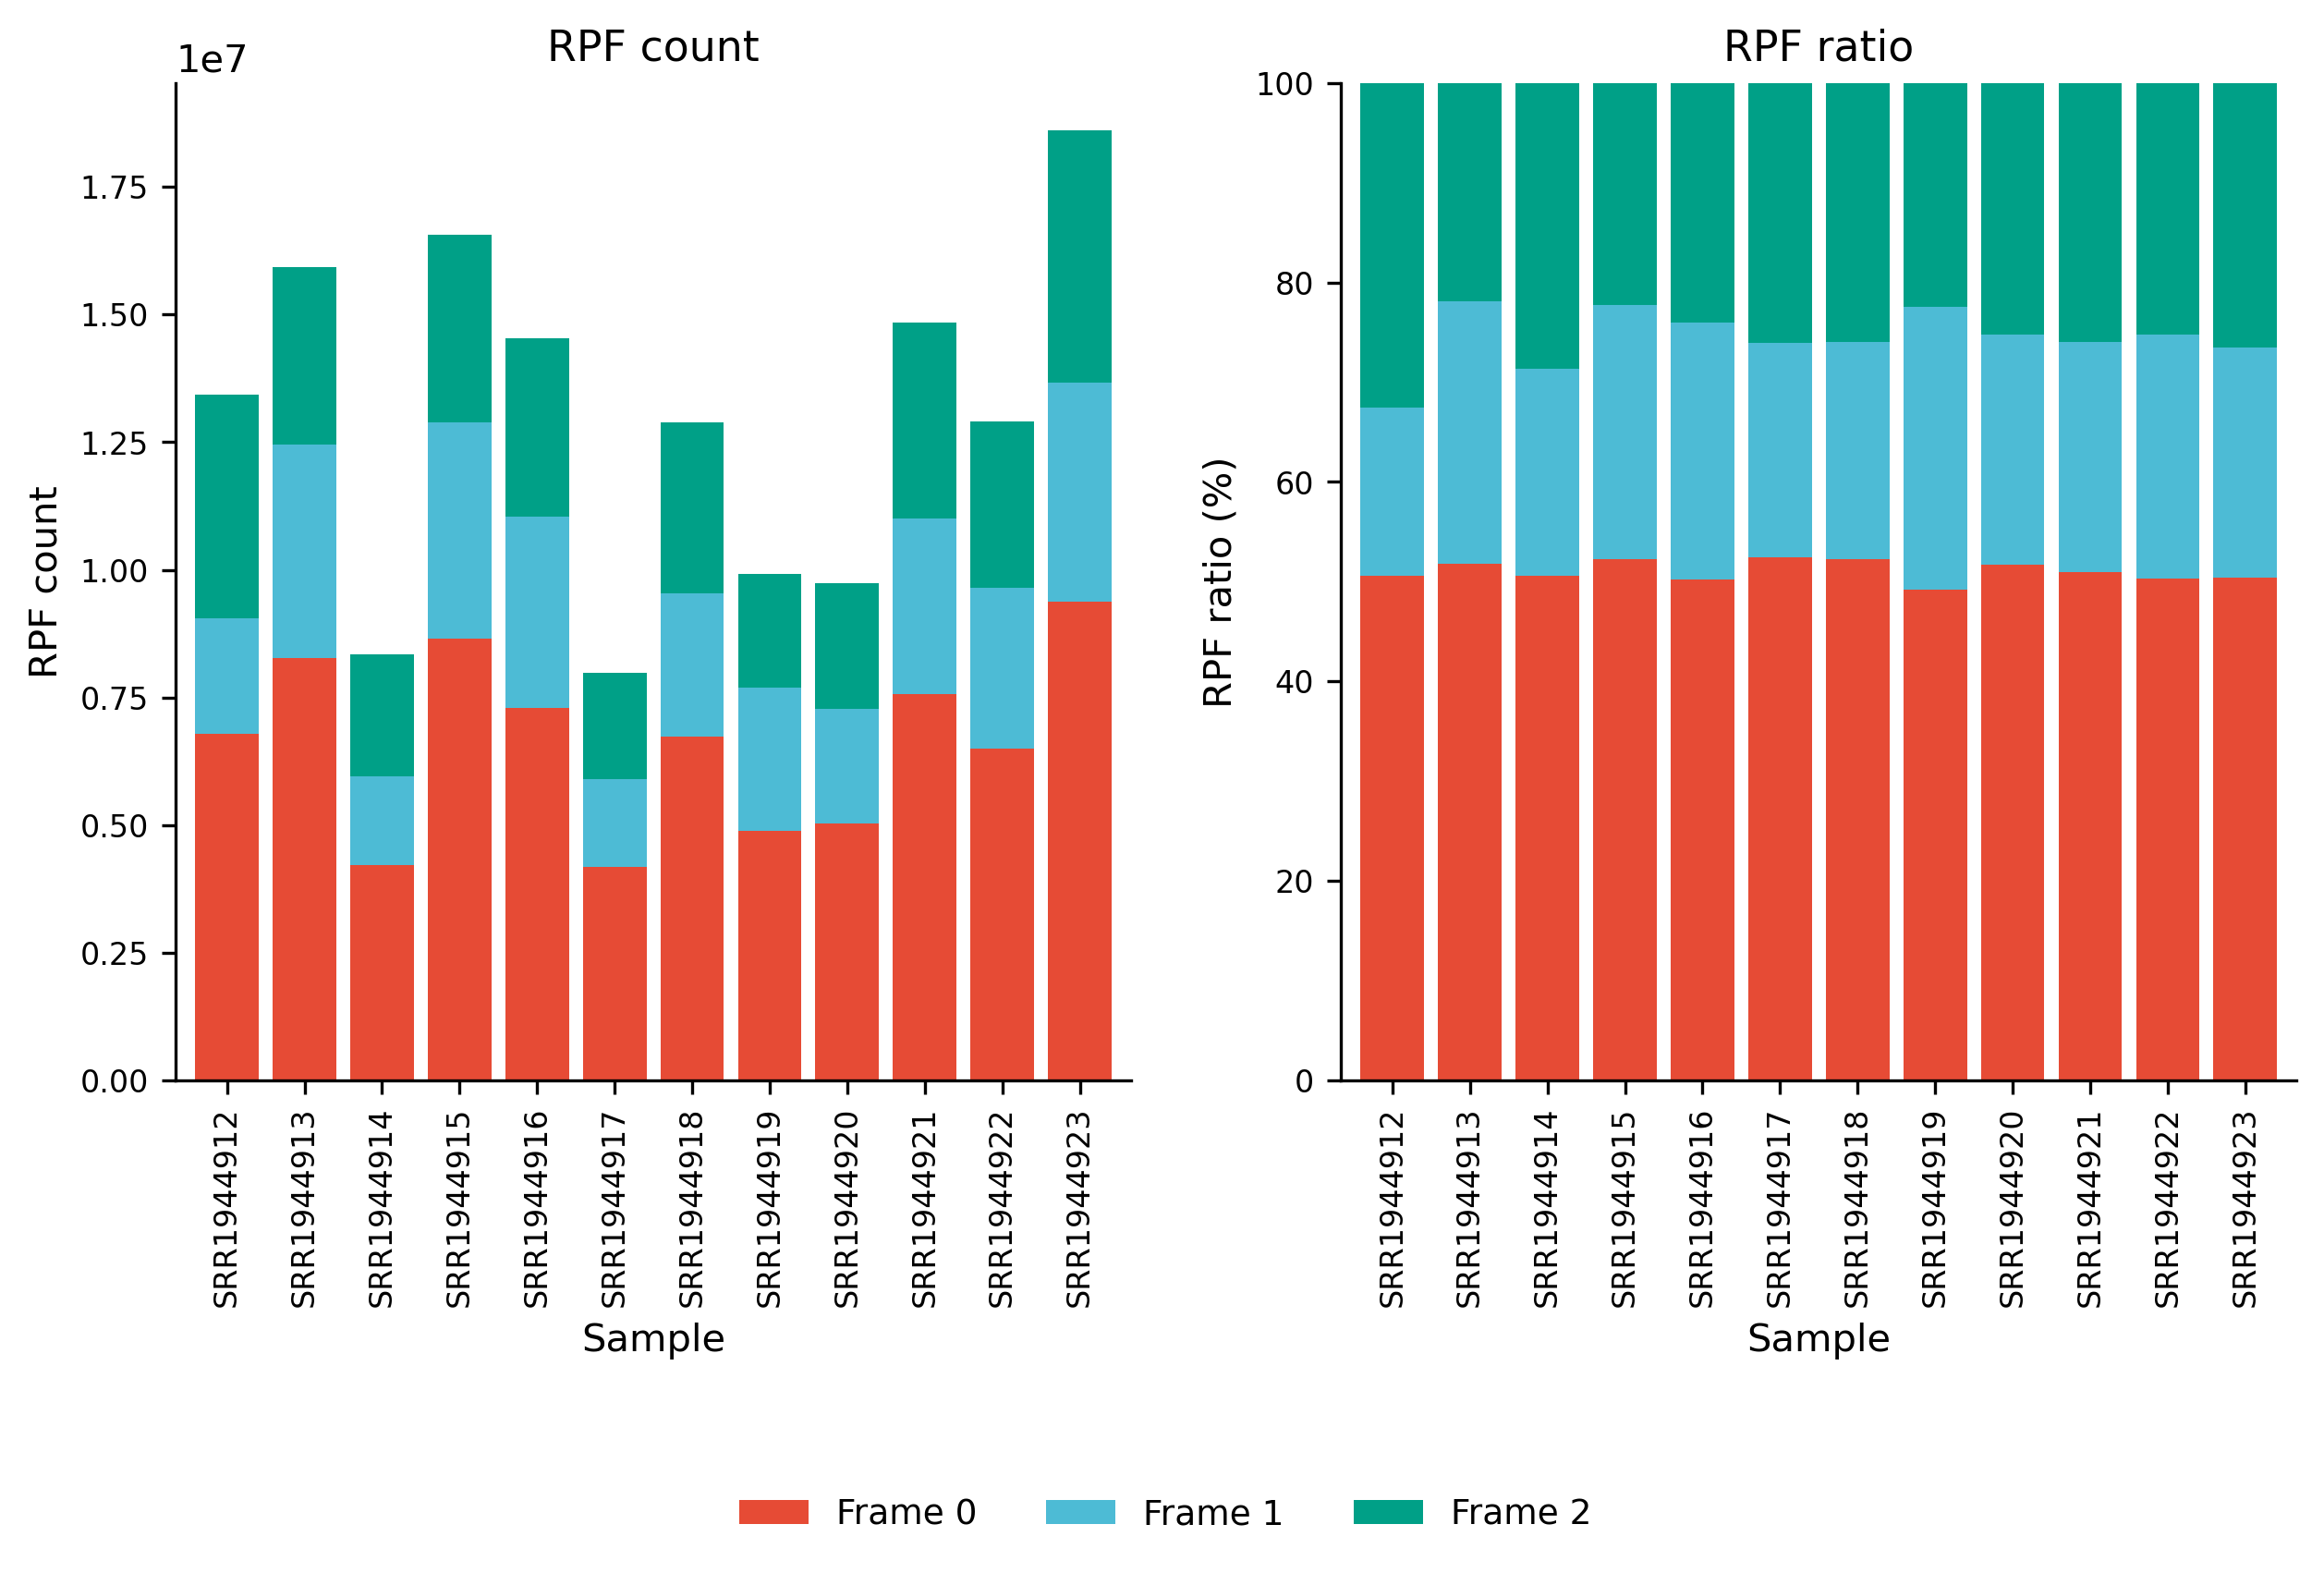
Two-panel stacked barplot summarizing all samples: RPF count (left) and RPF ratio (right). |
Example output figures
Barplot of frame-specific RPF counts for each sample (sce_count_periodicity_plot.png):
Barplot of frame-specific RPF ratios (%) for each sample (sce_ratio_periodicity_plot.png):
Stacked barplot summarizing all samples, with RPF count (left panel) and RPF ratio (right panel) (sce_stacked_periodicity_plot.png):
Step 2: Run merge_period
Merge periodicity tables from multiple samples or analyses into a single table.
2.1 Parameters
| Parameter | Required | Description |
|---|---|---|
-l, --list |
Yes | Input *_periodicity.txt files. Multiple files can be provided, e.g. -l *_periodicity.txt or explicit file paths. |
-o, --output |
Yes | Output prefix. The merged table is written to <prefix>_periodicity.txt. |
2.2 Example
2.3 Output
| Output | Description |
|---|---|
<prefix>_periodicity.txt |
Merged periodicity table, concatenated from all input files, with the same Sample, Frame, Count, Ratio columns. |
Notes
- High-quality Ribo-seq data should show strong enrichment in one reading frame (usually frame 0, the P-site frame).
- The
Ratiocolumn is the percentage of reads assigned to each frame, calculated asCount / total count of the sample * 100. - Low periodicity suggests that codon-level analyses should be interpreted cautiously.
- Increasing
--tisor--ttscan help remove boundary effects around start and stop codons. --tis/--ttstrimming is applied when the density file is imported; transcripts with low total counts (below-m) are removed before the periodicity is calculated.