4.7.1 Codon pausing score
Purpose
rpf_Pausing calculates sample-specific codon pausing scores from the merged density file produced by rpf_Merge (JSONL/JSONL.GZ or the legacy TXT table). For each CDS codon, the pausing score compares its RPF density with a background expectation — either the gene/sample mean CDS density (-b 0) or a local window of flanking codons (-b N). The per-codon scores are then summarized by gene and by codon, and visualized as correlation, heatmap, and rank plots.
Key features:
- Sample-specific filtering – for each sample, only transcripts with at least
-mCDS RPFs are retained. - Always excludes stop codons – the termination codon is never part of the summary; there is no
--stopswitch. - Optional outlier removal – isolated extreme density pileups can be detected and removed before the background and scores are calculated (
--remove-outlier). - Absolute and relative scores – the summary table stores both the raw (absolute) pausing score and the sample-wise scaled (relative) score for all codon positions and for positions with detected RPF.
The analysis is performed in five steps:
- Argument check and file validation – check the input arguments and the RPF density file.
- Data import – load the compact JSONL records (or the TXT table) and rebuild the codon-resolved density per sample.
- Sample-wise pausing calculation – filter transcripts, optionally remove outliers, compute the pausing score of every CDS codon against the chosen background.
- Table export – write the gene-level, codon-level, and (with
--all) position-level tables. - Plotting – draw the sample correlation heatmap, the combined codon pausing heatmap, and the per-sample codon rank plot, and write
_pausing.summary.json.
Step 1: Run rpf_Pausing
The input is the merged density file produced by rpf_Merge (see 4.5.5 Merge density). Both the compact JSONL format and the plain TXT table are supported.
1.1 Parameters
| Parameter | Required | Description |
|---|---|---|
-r, --rpf |
Yes | Input RPF density file (JSONL/JSONL.GZ/TXT) produced by rpf_Merge. |
-o, --output |
Yes | Output prefix. |
-l, --list |
No | Optional transcript filter table (TXT). The transcript_id column is used when available, otherwise the first column. If omitted, all transcripts in the file are used. |
-m, --min |
No | Minimum sample-specific CDS RPF count required for a transcript to be included. Default 50. |
--tis |
No | Discard this number of CDS codons after the translation initiation site. Default 10 (amino acids). |
--tts |
No | Discard this number of CDS codons before the translation termination site. Default 5 (amino acids). |
-s, --site |
No | Ribosomal site used for pausing calculation. Choices E, P, A. Default P. |
-f, --frame |
No | Reading frame used for pausing calculation. Choices 0, 1, 2, all. Default all. |
-b, --background |
No | Number of neighboring codons on each side used as local background. Default 0 (use the mean CDS density of each gene and sample). The focal codon is excluded from the local window. |
--thread |
No | Number of sample-level worker threads (capped at the sample count automatically). Default 1. |
-n, --normal |
No | Normalize density to RPM before pausing calculation. Ratios are mathematically unchanged within a sample, but the normalized density is retained in exported intermediate tables. Disabled by default. |
--ind |
No | For valid-codon summaries, require positive RPF density independently within each sample. Disabled by default. |
--remove-outlier |
No | Remove isolated extreme raw-density pileups before background and pausing-score calculation. Disabled by default. |
--outlier-iqr |
No | IQR multiplier for the global extreme-pileup detection. Default 8.0. |
--outlier-window |
No | Neighboring codons on each side used to confirm an isolated outlier. Default 5. |
--outlier-local-fold |
No | Minimum fold over the local background required for a pileup to be removed as an outlier. Default 10.0. |
--scale |
No | Sample-wise scaling applied to the relative codon pausing scores. Choices none, minmax, zscore. Default minmax. |
--plot-transform |
No | Transform applied to the absolute pausing scores for plotting only (output tables are unchanged). Choices none, sqrt, log, log1p, log2, log10. log is an alias of log1p. Default none. |
--all |
No | Output the detailed transcript-position and transcript-codon pausing tables in addition to the default tables. Disabled by default. |
1.2 Example
cd ./sce/4.ribo-seq/11.pausing_score/

rpf_Pausing \
    -r ../05.merge/sce_rpf_merged.jsonl.gz \
    -o sce \
    -s P \
    -f all \
    -b 4 \
    -m 50 \
    --tis 10 \
    --tts 5 \
    --remove-outlier \
    --outlier-iqr 8 \
    --outlier-window 5 \
    --outlier-local-fold 10 \
    --scale minmax \
    --plot-transform log1p \
    --thread 10 \
    &> sce_pausing.log
1.3 Output
All output files are written to the current working directory with the given prefix:
| Output | Description |
|---|---|
<prefix>_cds_pausing_score.txt |
Gene-level CDS pausing summary: one row per gene-sample pair. |
<prefix>_sum_codon_pausing_score.txt |
Codon-level summary: one row per codon, with counts, RPF density, and absolute/relative pausing scores per sample. |
<prefix>_cds_codon_pausing_score.txt |
Per-gene and per-codon pausing score table. Generated only with --all. |
<prefix>_all_pausing_score.txt |
Detailed transcript-position/transcript-codon pausing table. Generated only with --all. |
<prefix>_pausing_corr.txt |
Sample correlation matrix computed from absolute codon pausing scores. |
<prefix>_pausing_corrplot.pdf / .png |
Sample correlation heatmap. |
<prefix>_codon_pausing_heatmap.pdf / .png |
Combined codon pausing heatmap: left panel All codon positions, right panel Positions with detected RPF. |
<prefix>_codon_pausing_rankplot.pdf / .png |
Per-sample codon rank plot of absolute valid pausing scores, with the top-scoring codons labeled. |
<prefix>_pausing.outliers.txt |
Records of the removed outlier positions. Generated only with --remove-outlier. |
<prefix>_pausing.summary.json |
Run parameters and per-sample summary (transcripts, valid scores, outlier counts). |
The gene-level table <prefix>_cds_pausing_score.txt contains:
name Sample CDSCodonCount ValidCodonCount PausingScoreSum PausingScoreMean PausingScoreMedian PausingScoreMax
The codon-level table <prefix>_sum_codon_pausing_score.txt contains Codon, AA, Abbr, TotalCodon followed by six per-sample columns for every sample:
<sample>_valid_codon <sample>_rpf_count <sample>_absolute_total_ps <sample>_absolute_valid_ps <sample>_relative_total_ps <sample>_relative_valid_ps
*_valid_codon– number of genes where the codon is included in the summary.*_rpf_count– total RPF counts assigned to the codon.*_absolute_*_ps– mean raw pausing score over all codon positions (total) or over positions with detected RPF (valid).*_relative_*_ps– the same mean scores after the sample-wise--scaletransform.
Example output figures
1. Sample correlation heatmap (_pausing_corrplot.png)
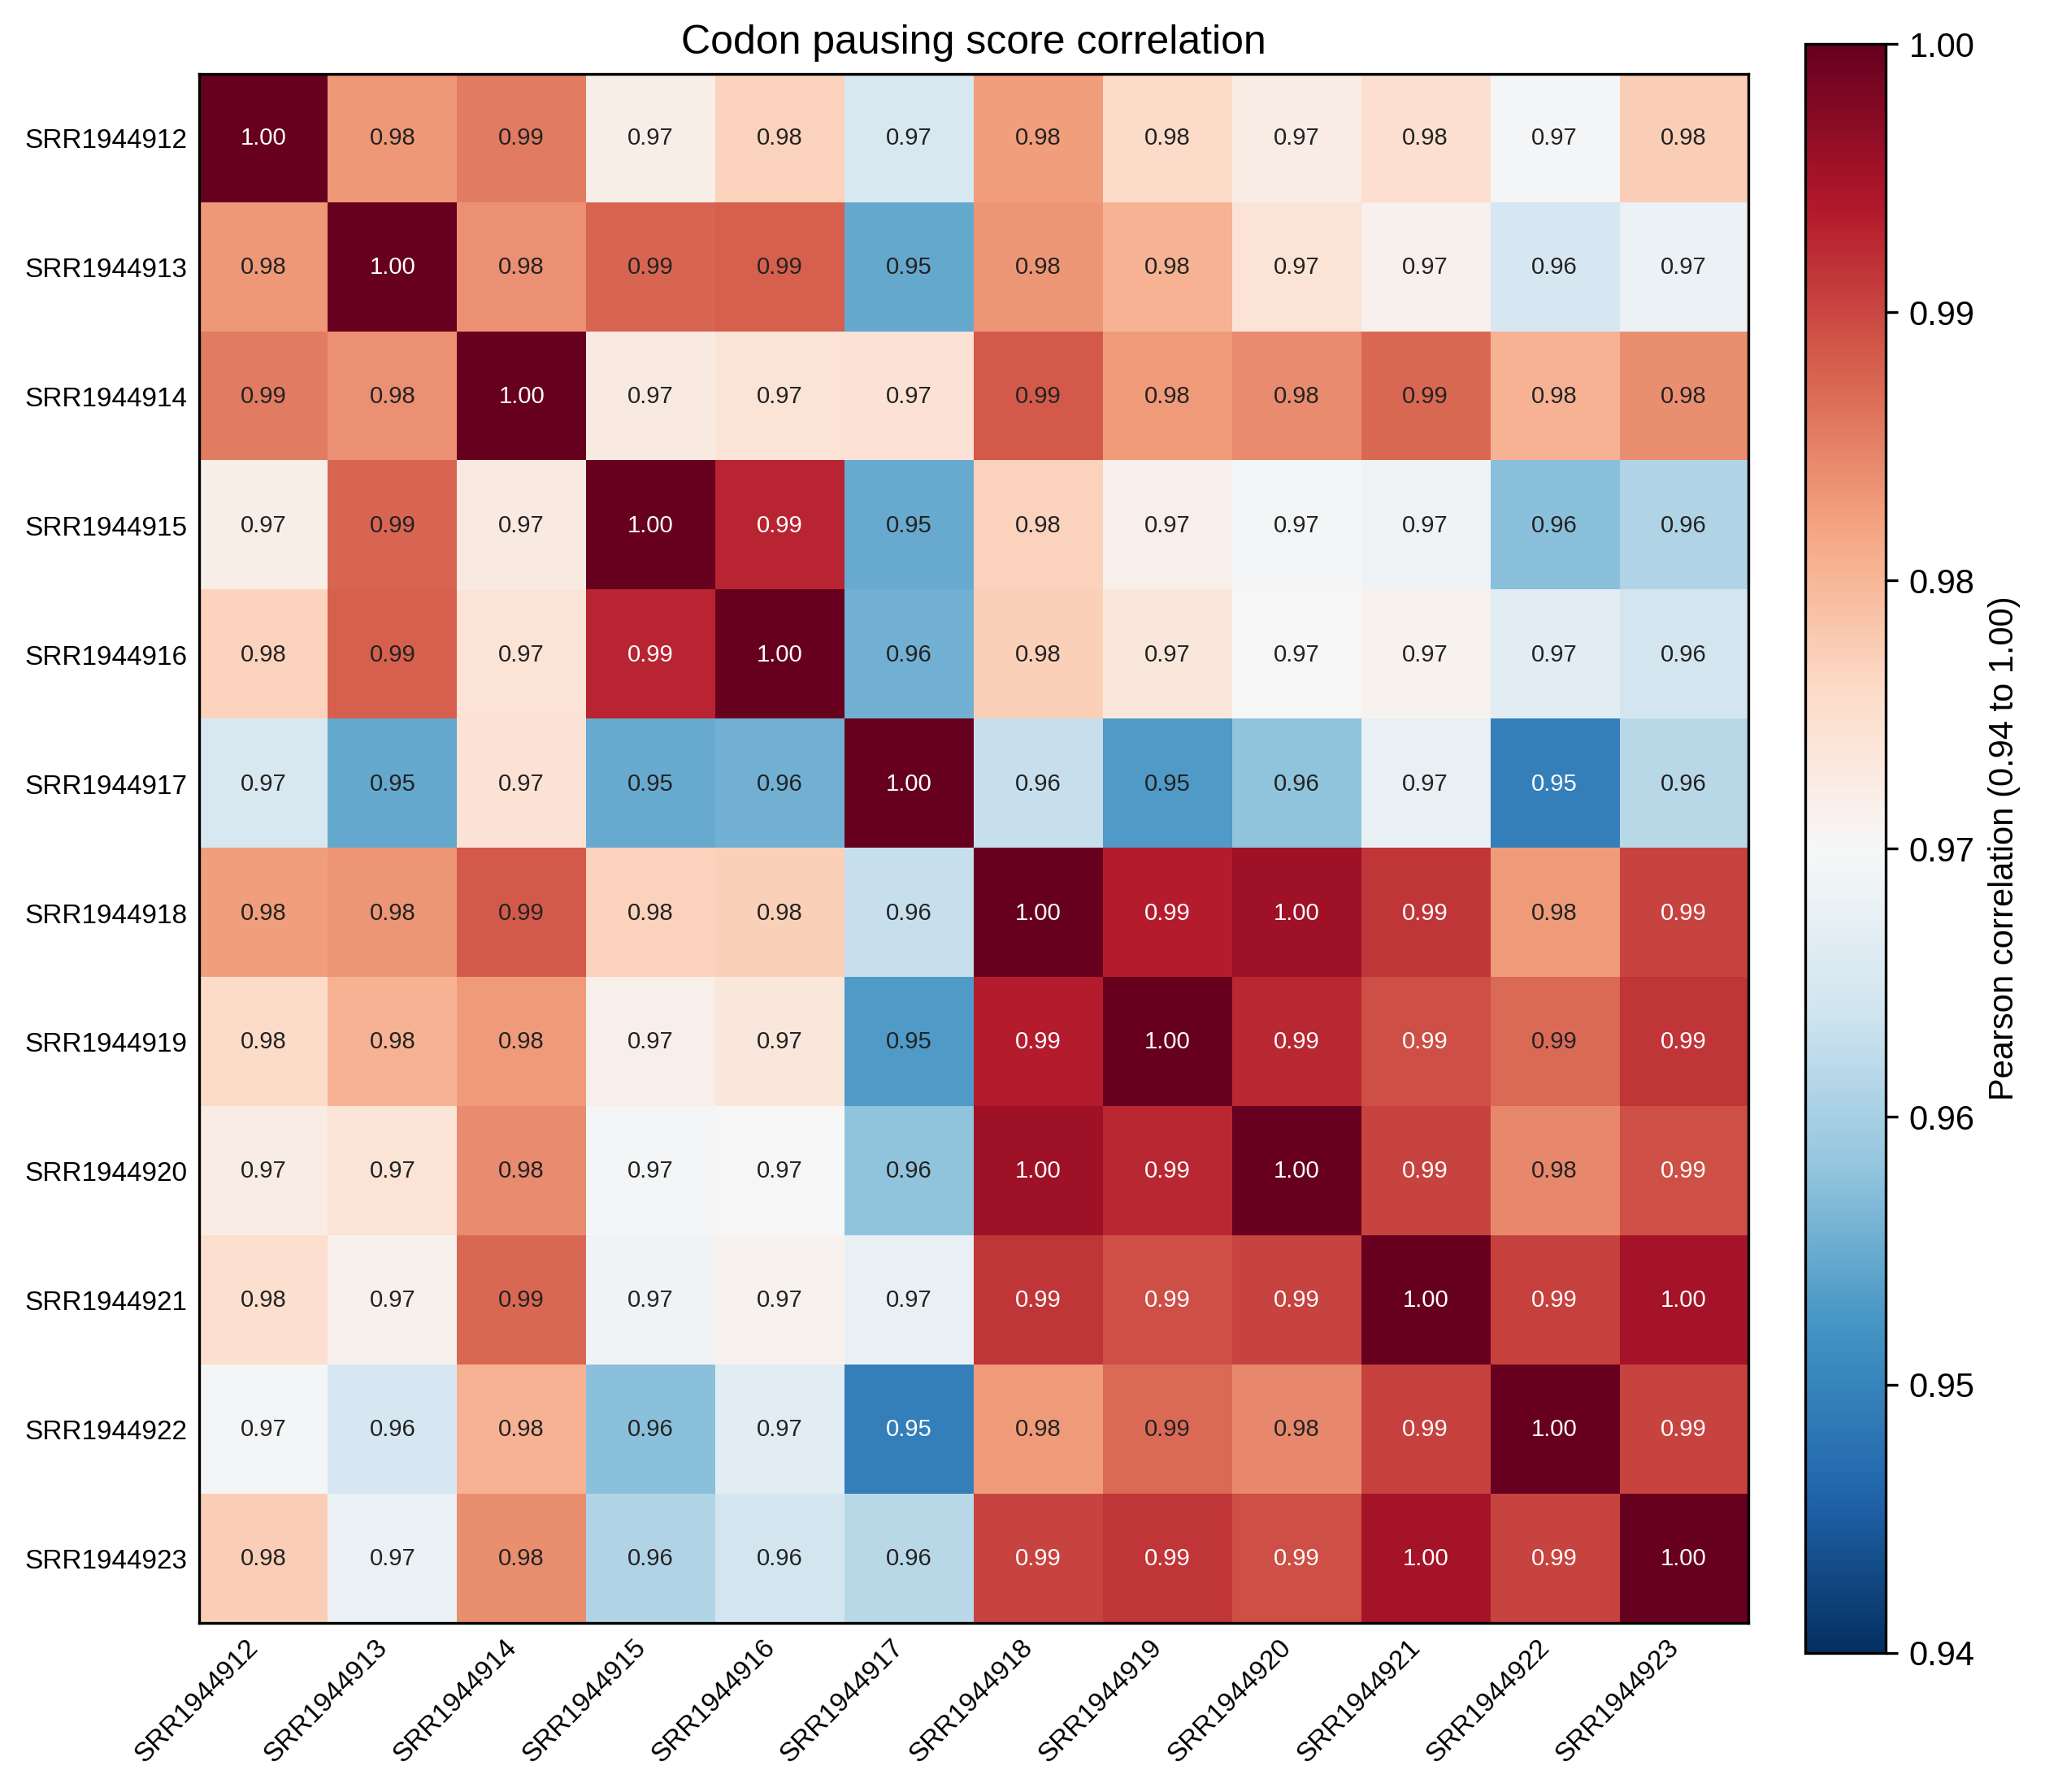
The correlation heatmap shows the Pearson (or Spearman) correlation of the absolute codon pausing profiles between all pairs of samples. High correlations between biological replicates and lower correlations between different conditions support the reproducibility of the pausing signal.
2. Combined codon pausing heatmap (_codon_pausing_heatmap.png)
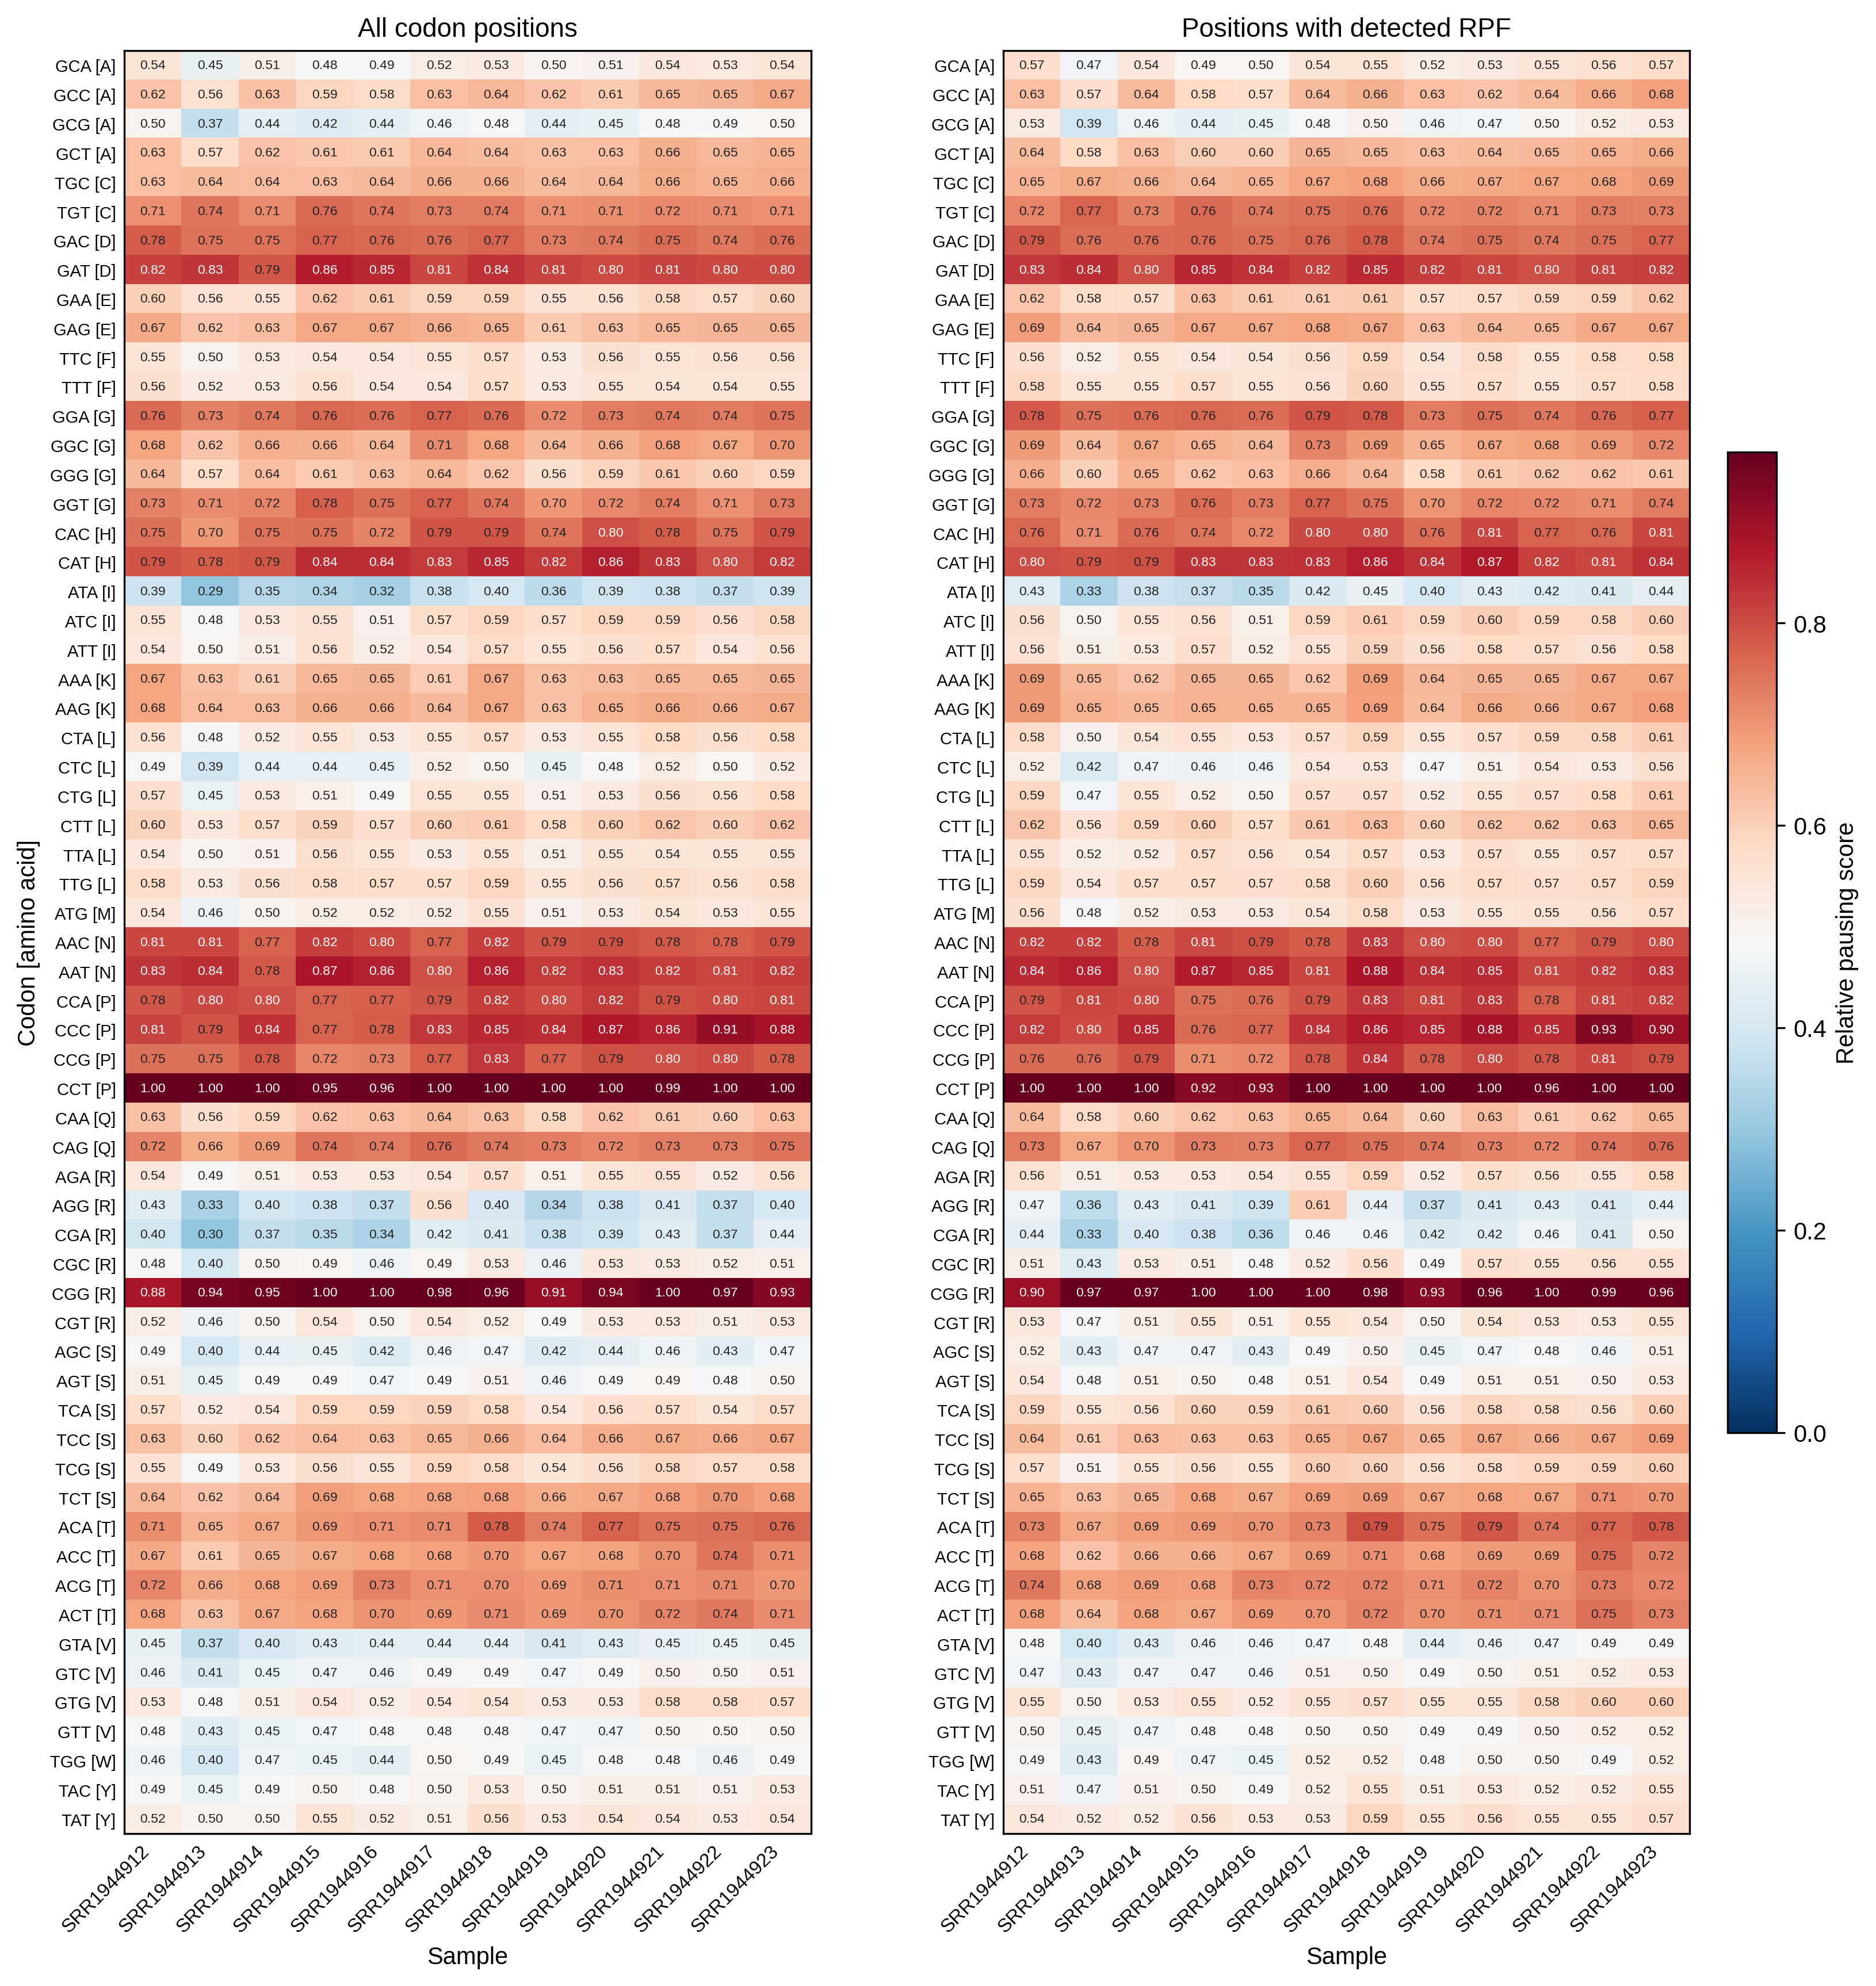
The combined heatmap contains two panels, rows being the 64 sense codons (labeled Codon [amino acid]) and columns being the samples. The left panel uses all CDS codon positions, the right panel only positions with detected RPF. The color bar reports the pausing score (relative after --scale, or absolute with the requested --plot-transform when --scale none).
3. Per-sample codon rank plot (_codon_pausing_rankplot.png)
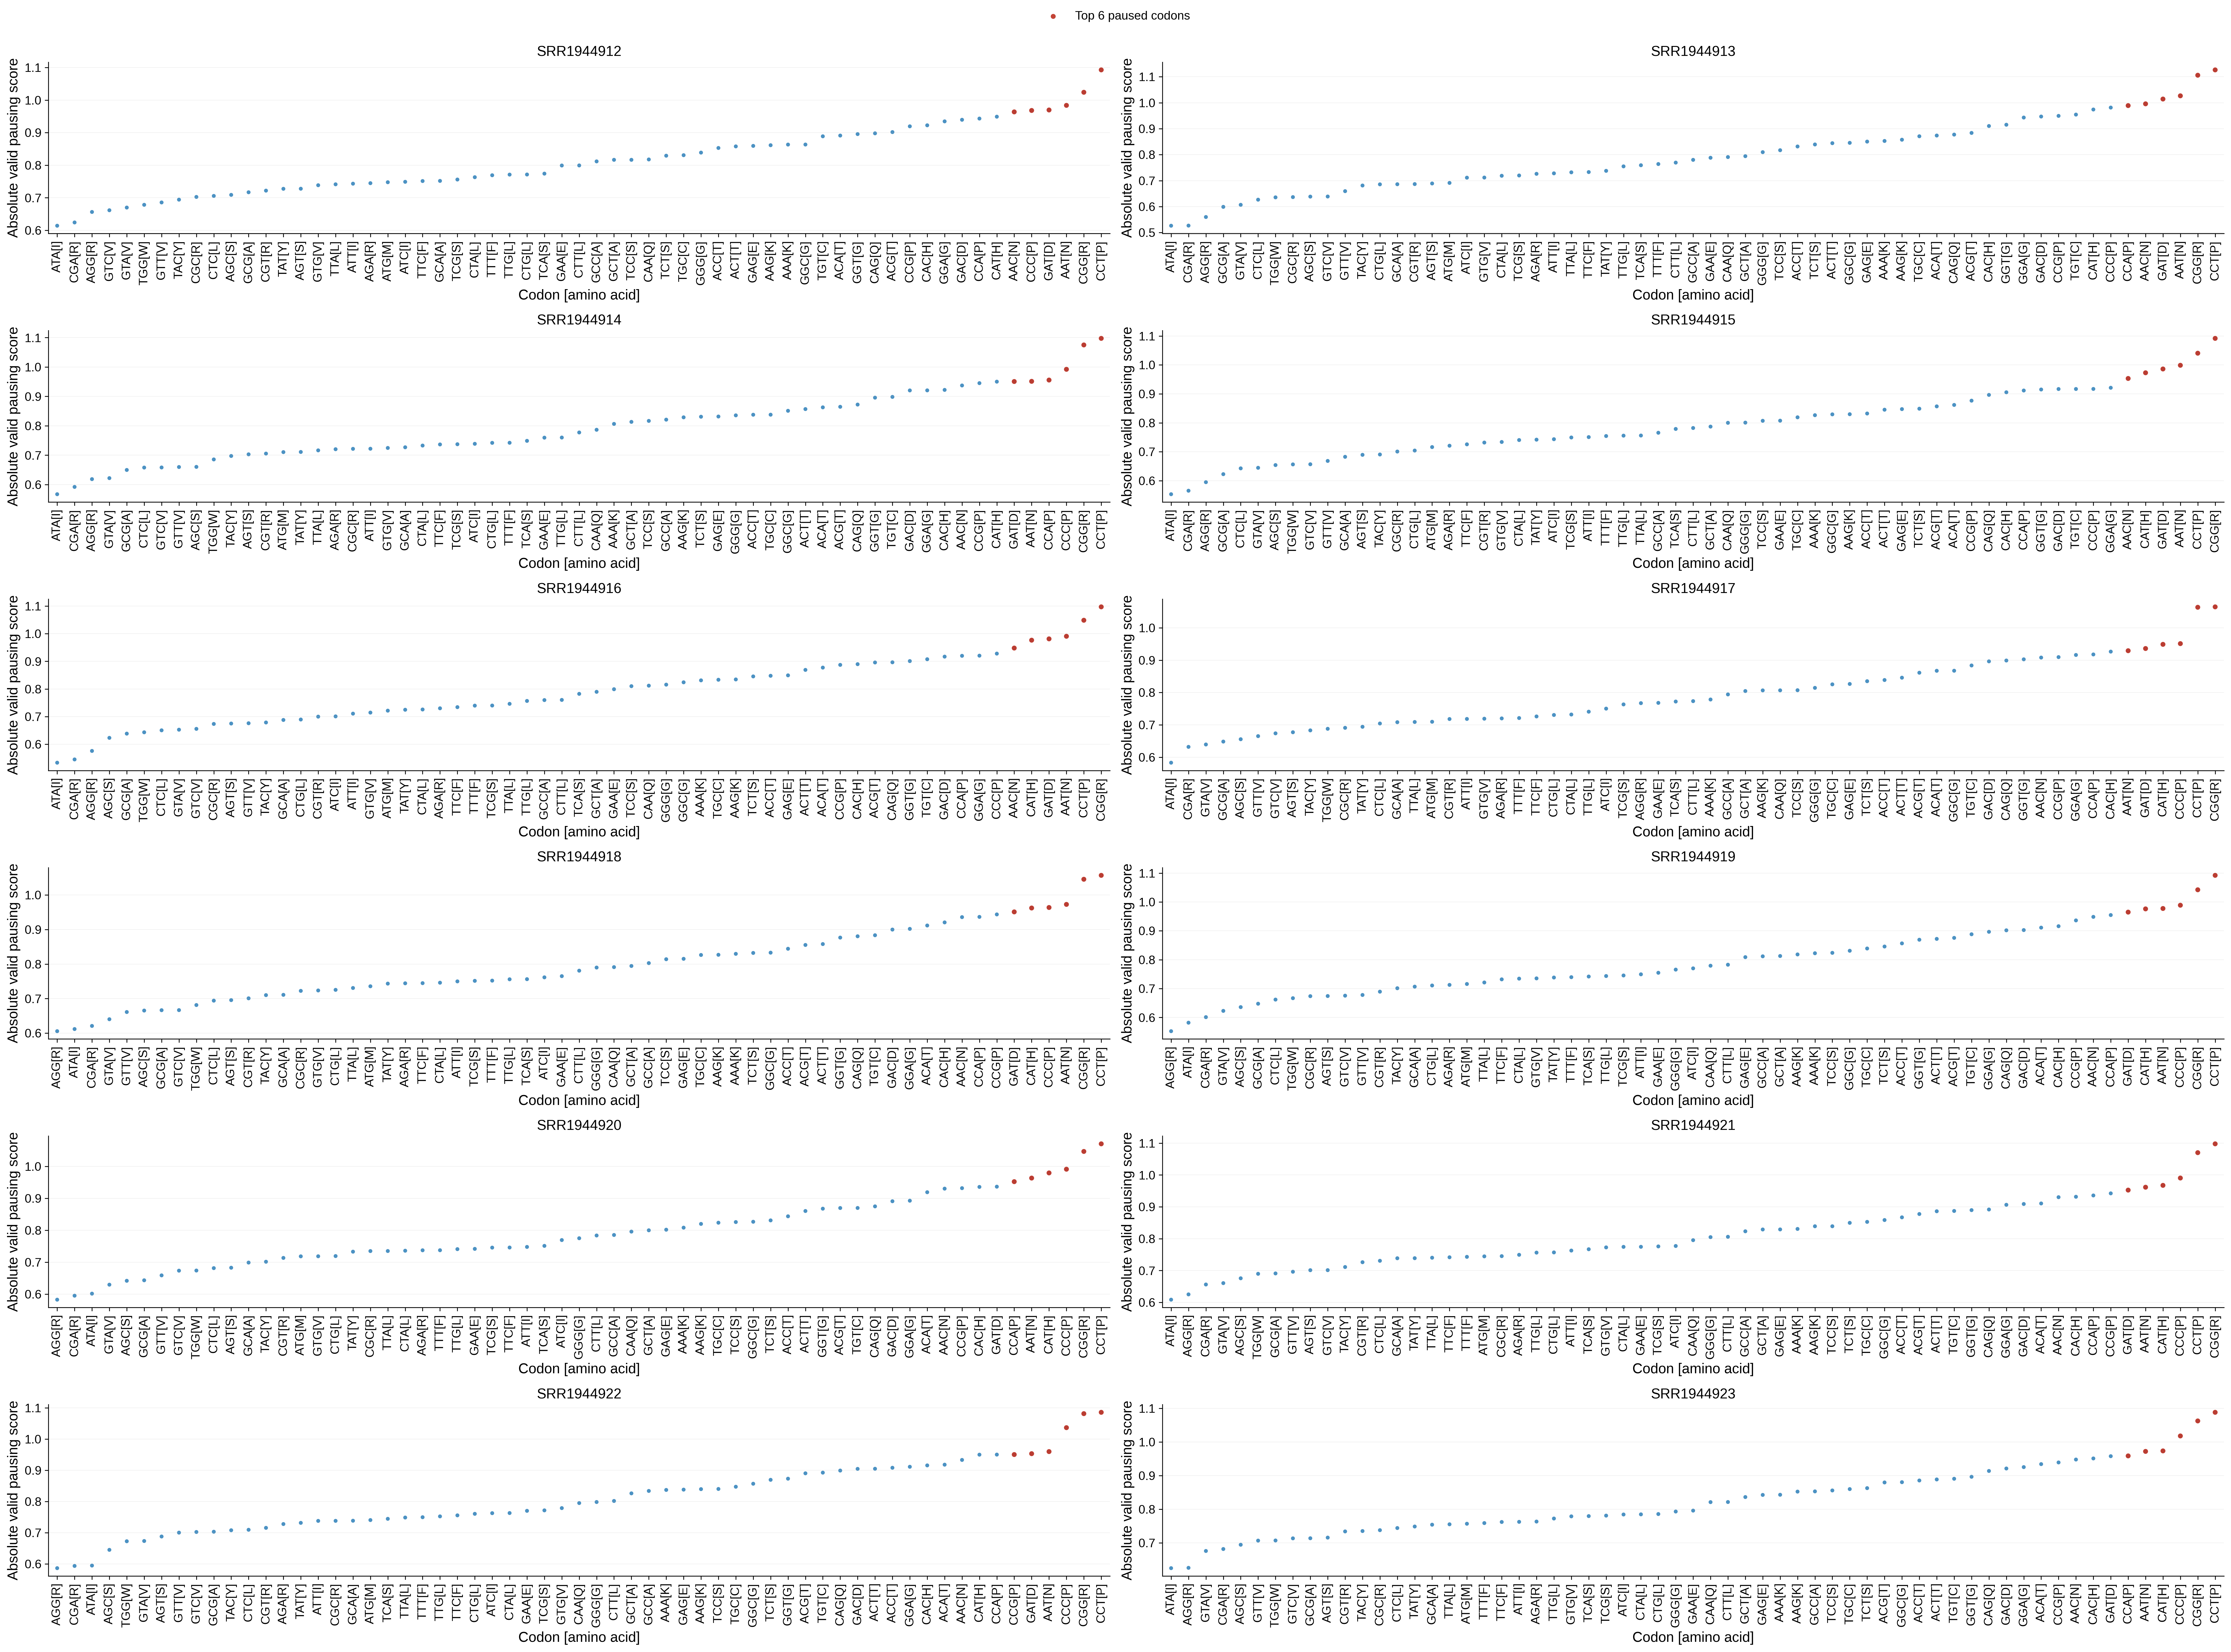
Each panel of the rank plot shows one sample: the x-axis lists the codons (rotated 90 degrees) ordered by their absolute valid pausing score, from lowest on the left to highest on the right, and the y-axis is the score itself. Because every codon is labeled on the x-axis, one panel is placed per row by default so that all 61 sense-codon labels fit without overlapping. The six top-scoring codons are highlighted in red, which makes it easy to spot sample-consistent pausing hotspots.
Use --rankplot-ncol to change the number of sample panels per row (default 1; e.g. 2 places two narrower panels per row and gives a more compact figure at the cost of a smaller label font).
Notes
- A pausing score larger than 1 indicates RPF enrichment of the codon relative to the chosen background; scores are computed per sample and per transcript and then summarized.
- Stop codons are always excluded from the calculation; the termination context is not part of the summary tables or figures.
-b 0uses the gene-sample mean CDS density as background, which highlights codons that pause relative to the gene average; positive-bvalues use a local window and are better for detecting sharp single-codon stalls.- The outlier removal (
--remove-outlier) is recommended for samples with strong 3'-end pileups or run-off artifacts; verify the flagged positions in<prefix>_pausing.outliers.txtbefore trusting them as biological pauses. - Candidate pausing codons should be interpreted together with RPF coverage, digestion bias, periodicity, and replicate consistency.
--plot-transformonly affects figures, while--scalechanges the relative score columns of the output tables.
Merge related results
Use merge_pausing to merge multiple codon pausing summary tables (e.g. from different sites or datasets) into one combined table: