4.7.8 Codon odds ratio
Purpose
rpf_Odd_Ratio compares codon-associated RPF enrichment between a control and a treatment sample group. For every codon position of every retained transcript it builds a 2×2 table, tests whether the signal at that single site is enriched or depleted in the treatment group relative to the rest of its transcript, and corrects the p-values with the Benjamini-Hochberg procedure. The significant sites are written to a site-level table, and a codon-level summary plus two figures are generated.
Key features:
- Site-level analysis – each row of the result table is one codon position of one transcript (
name+now_nt/from_tis/from_tts+codon), so the statistics report the stalling status of a single site, not of a codon across the genome. - Within-transcript normalization – the signal of each site is compared with the remaining signal of its own transcript, which removes transcript-level expression differences between the two groups.
- Statistical testing – a 2×2 chi-square test is performed per site (
statsmodels.Table2x2), followed by BH multiple-testing correction. - Flexible significance filtering – choose whether the significant sites are filtered by the raw
pvalueor the correctedbhfdr. - Codon-level summary – significant sites are aggregated by codon to count and quantify enrichment/depletion directions.
- Two figures – a line plot and a scatter plot that visualize the codon-level counts and proportions.
The analysis is performed in seven steps:
- Argument check and file validation – check the input arguments and the RPF density file.
- Data import – import the density file with
RPFs.import_rpf(P-site coordinates, reading-frame filter, TIS/TTS trimming, optional transcript list, high-expression filter, optional RPM normalization), keep only known codons, and drop positions without RPF coverage. - Build 2×2 tables – for each site, sum the control and treatment signals; for each transcript, sum the control and treatment totals.
- Calculate odds ratios –
odd = (treat / treat_delta) / (control / control_delta). - Statistical tests – parallel chi-square tests per site, BH correction to obtain
bhfdrand the significanceflag. - Output – filter the sites and write the site-level table; aggregate by codon and write the summary table.
- Draw figures – line plot and scatter plot of the codon-level summary.
Algorithm
For each codon position of each retained transcript the following 2×2 table is constructed:
              | site signal | transcript remainder
--------------+-------------+----------------------
control group | control    | control_delta
treatment     | treat      | treat_delta
where
control       = sum of the site signal over the control samples
treat         = sum of the site signal over the treatment samples
control_sum   = total signal of the transcript over the control samples
treat_sum     = total signal of the transcript over the treatment samples
control_delta = control_sum - control
treat_delta   = treat_sum - treat
The odds ratio is the ratio of the two within-transcript proportions:
odd > 1– the site is relatively more occupied (stalled) in the treatment group than in the control group.odd < 1– the site is relatively depleted in the treatment group.odd = 1– no change in the relative signal at the site.
Because control_delta and treat_delta are the transcript totals minus the site signal, the comparison is made within each transcript: a highly expressed transcript no longer dominates the test, and the statistic reflects the relative redistribution of ribosomes at the single site.
The p-value of each site is obtained from a chi-square test on its 2×2 table, computed in parallel with --thread workers. The raw p-values are then corrected with the Benjamini-Hochberg method (multipletests, fdr_bh):
pvalue– raw chi-square p-value of the site.bhfdr– BH-corrected FDR value.flag– Boolean significance marker (bhfdr < 0.05).
By default (--fdr bhfdr) sites are filtered on bhfdr; with --fdr pvalue they are filtered on the raw pvalue.
Step 1: Run rpf_Odd_Ratio
The input is the frame-resolved RPF density file produced by rpf_Merge (see 4.5.5 Merge density), either the TXT table or the JSONL/JSONL.GZ format. The control and treatment sample names must exactly match the sample columns in the density file.
1.1 Parameters
| Parameter | Required | Description |
|---|---|---|
-r, --rpf |
Yes | Input frame-resolved RPF density file (JSONL/JSONL.GZ/TXT). |
-o, --output |
Yes | Output file prefix. |
-c, --control |
Yes | Comma-separated control sample names. |
-t, --treat |
Yes | Comma-separated treatment sample names. |
-l, --list |
No | Optional transcript ID list (TXT). If omitted, all transcripts are used. |
-s, --site |
No | Ribosome site used for coordinate assignment. Choices E, P, A. Default P. |
-f, --frame |
No | Reading frame used for calculation. Choices 0, 1, 2, all. Default all. |
-m, --min |
No | Minimum RPF count required for retained transcripts. Default 50. |
--tis |
No | Number of codons removed after TIS. Default 0. |
--tts |
No | Number of codons removed before TTS. Default 0. |
--stop |
No | Remove stop codons from the analysis. Disabled by default. |
--thread |
No | Number of worker processes for the p-value calculation. Default 1. |
-n, --normal |
No | Normalize RPF counts to RPM before the analysis. Disabled by default. |
-z, --zero |
No | Retain zero-density positions by adding 0.01 * minimal RPM to every position. Disabled by default (positions with zero coverage are dropped). |
--fdr |
No | Significance field used for filtering. Choices bhfdr, pvalue. Default bhfdr. |
-v, --value |
No | Significance threshold for the selected field. Default 0.05. |
--scale |
No | Scaling method used for the relative summary values. Choices zscore, minmax. Default minmax. |
1.2 Example
cd ./sce/4.ribo-seq/18.odd_ratio/

rpf_Odd_Ratio \
    -r ../05.merge/sce_rpf_merged.jsonl.gz \
    -c SRR1944912,SRR1944913,SRR1944914 \
    -t SRR1944921,SRR1944922,SRR1944923 \
    --fdr pvalue \
    -o sce \
    -n \
    --thread 8 \
    &> sce_codon_odd_ratio.log
In this example, three control samples (SRR1944912–14) are compared with three treatment samples (SRR1944921–23). RPF counts are normalized to RPM (-n), sites are filtered by the raw p-value (--fdr pvalue) at the default threshold 0.05, and eight worker processes are used for the chi-square tests.
1.3 Output
All output files are written to the current working directory with the given prefix:
| Output | Description |
|---|---|
<prefix>_codon_odd_ratio.txt |
Site-level table of the significant codon positions after the selected p-value/FDR filtering. |
<prefix>_codon_local_pause.txt |
Site-level table of the detected local pause sites; used as the input of rpf_PSplot (see 4.7.9 Pause site plot). |
<prefix>_sum_codon_odd_ratio.txt |
Codon-level summary table with counts, proportions, and relative values. |
<prefix>_odd_lineplot.pdf / .png |
Two-panel line plot of the significant codon counts and proportions. |
<prefix>_odd_scatter.pdf / .png |
Two-panel scatter plot of the control-vs-treatment counts and proportions. |
Site-level table <prefix>_codon_odd_ratio.txt – one row per significant site:
name now_nt from_tis from_tts region codon SRR1944912 SRR1944913 SRR1944914 SRR1944921 SRR1944922 SRR1944923 control treat control_sum treat_sum odd pvalue bhfdr flag
Important: every row of this table represents the stalling status of a single site – the codon position of a single transcript. The columns
name,now_nt,from_tis,from_tts, andcodonidentify exactly where the site is located.odd,pvalue, andbhfdrdescribe the enrichment at that individual site only, and must be cross-checked against the original density file (for example the merged file given to-ror the per-transcript profiles extracted withrpf_Retrieve) at the reported position before biological interpretation.
name– transcript ID.now_nt– nucleotide position of the site.from_tis/from_tts– codon offset from the translation initiation / termination site (negative values are upstream of the TTS).region–cdsfor CDS positions.codon– codon at the site.- Sample columns – the (RPM-normalized) density of each control and treatment sample at this site.
control/treat– the site signal summed over the control / treatment samples.control_sum/treat_sum– the transcript total signal in the control / treatment group.odd– the odds ratio defined in the Algorithm section.pvalue– chi-square p-value of the site.bhfdr– BH-corrected FDR of the site.flag– whether the site is significant after BH correction (bhfdr < 0.05).
Note that with --fdr pvalue all rows of this table satisfy pvalue < 0.05, but flag is always computed from the BH-corrected value.
Summary table <prefix>_sum_codon_odd_ratio.txt – one row per codon:
Codon AA Abbr codon_sum control_codon_sum treat_codon_sum control_mean_odd_ratio treat_mean_odd_ratio control_number treat_number control_proportion treat_proportion control_number_relative treat_number_relative control_proportion_relative treat_proportion_relative control_group treat_group
codon_sum– number of sites carrying this codon.control_codon_sum/treat_codon_sum– total signal of this codon over the control / treatment group.control_mean_odd_ratio/treat_mean_odd_ratio– average signal of the sites withodd < 1(control side) /odd > 1(treatment side).control_number/treat_number– number of significant sites withodd < 1/odd > 1.control_proportion/treat_proportion–number / codon_sum * 100.*_relative– the number / proportion columns rescaled with--scale(minmaxdivides by the maximum;zscorestandardizes).control_group/treat_group– the sample names of the two groups.
Example output figures
1. Line plot (sce_odd_lineplot.png)
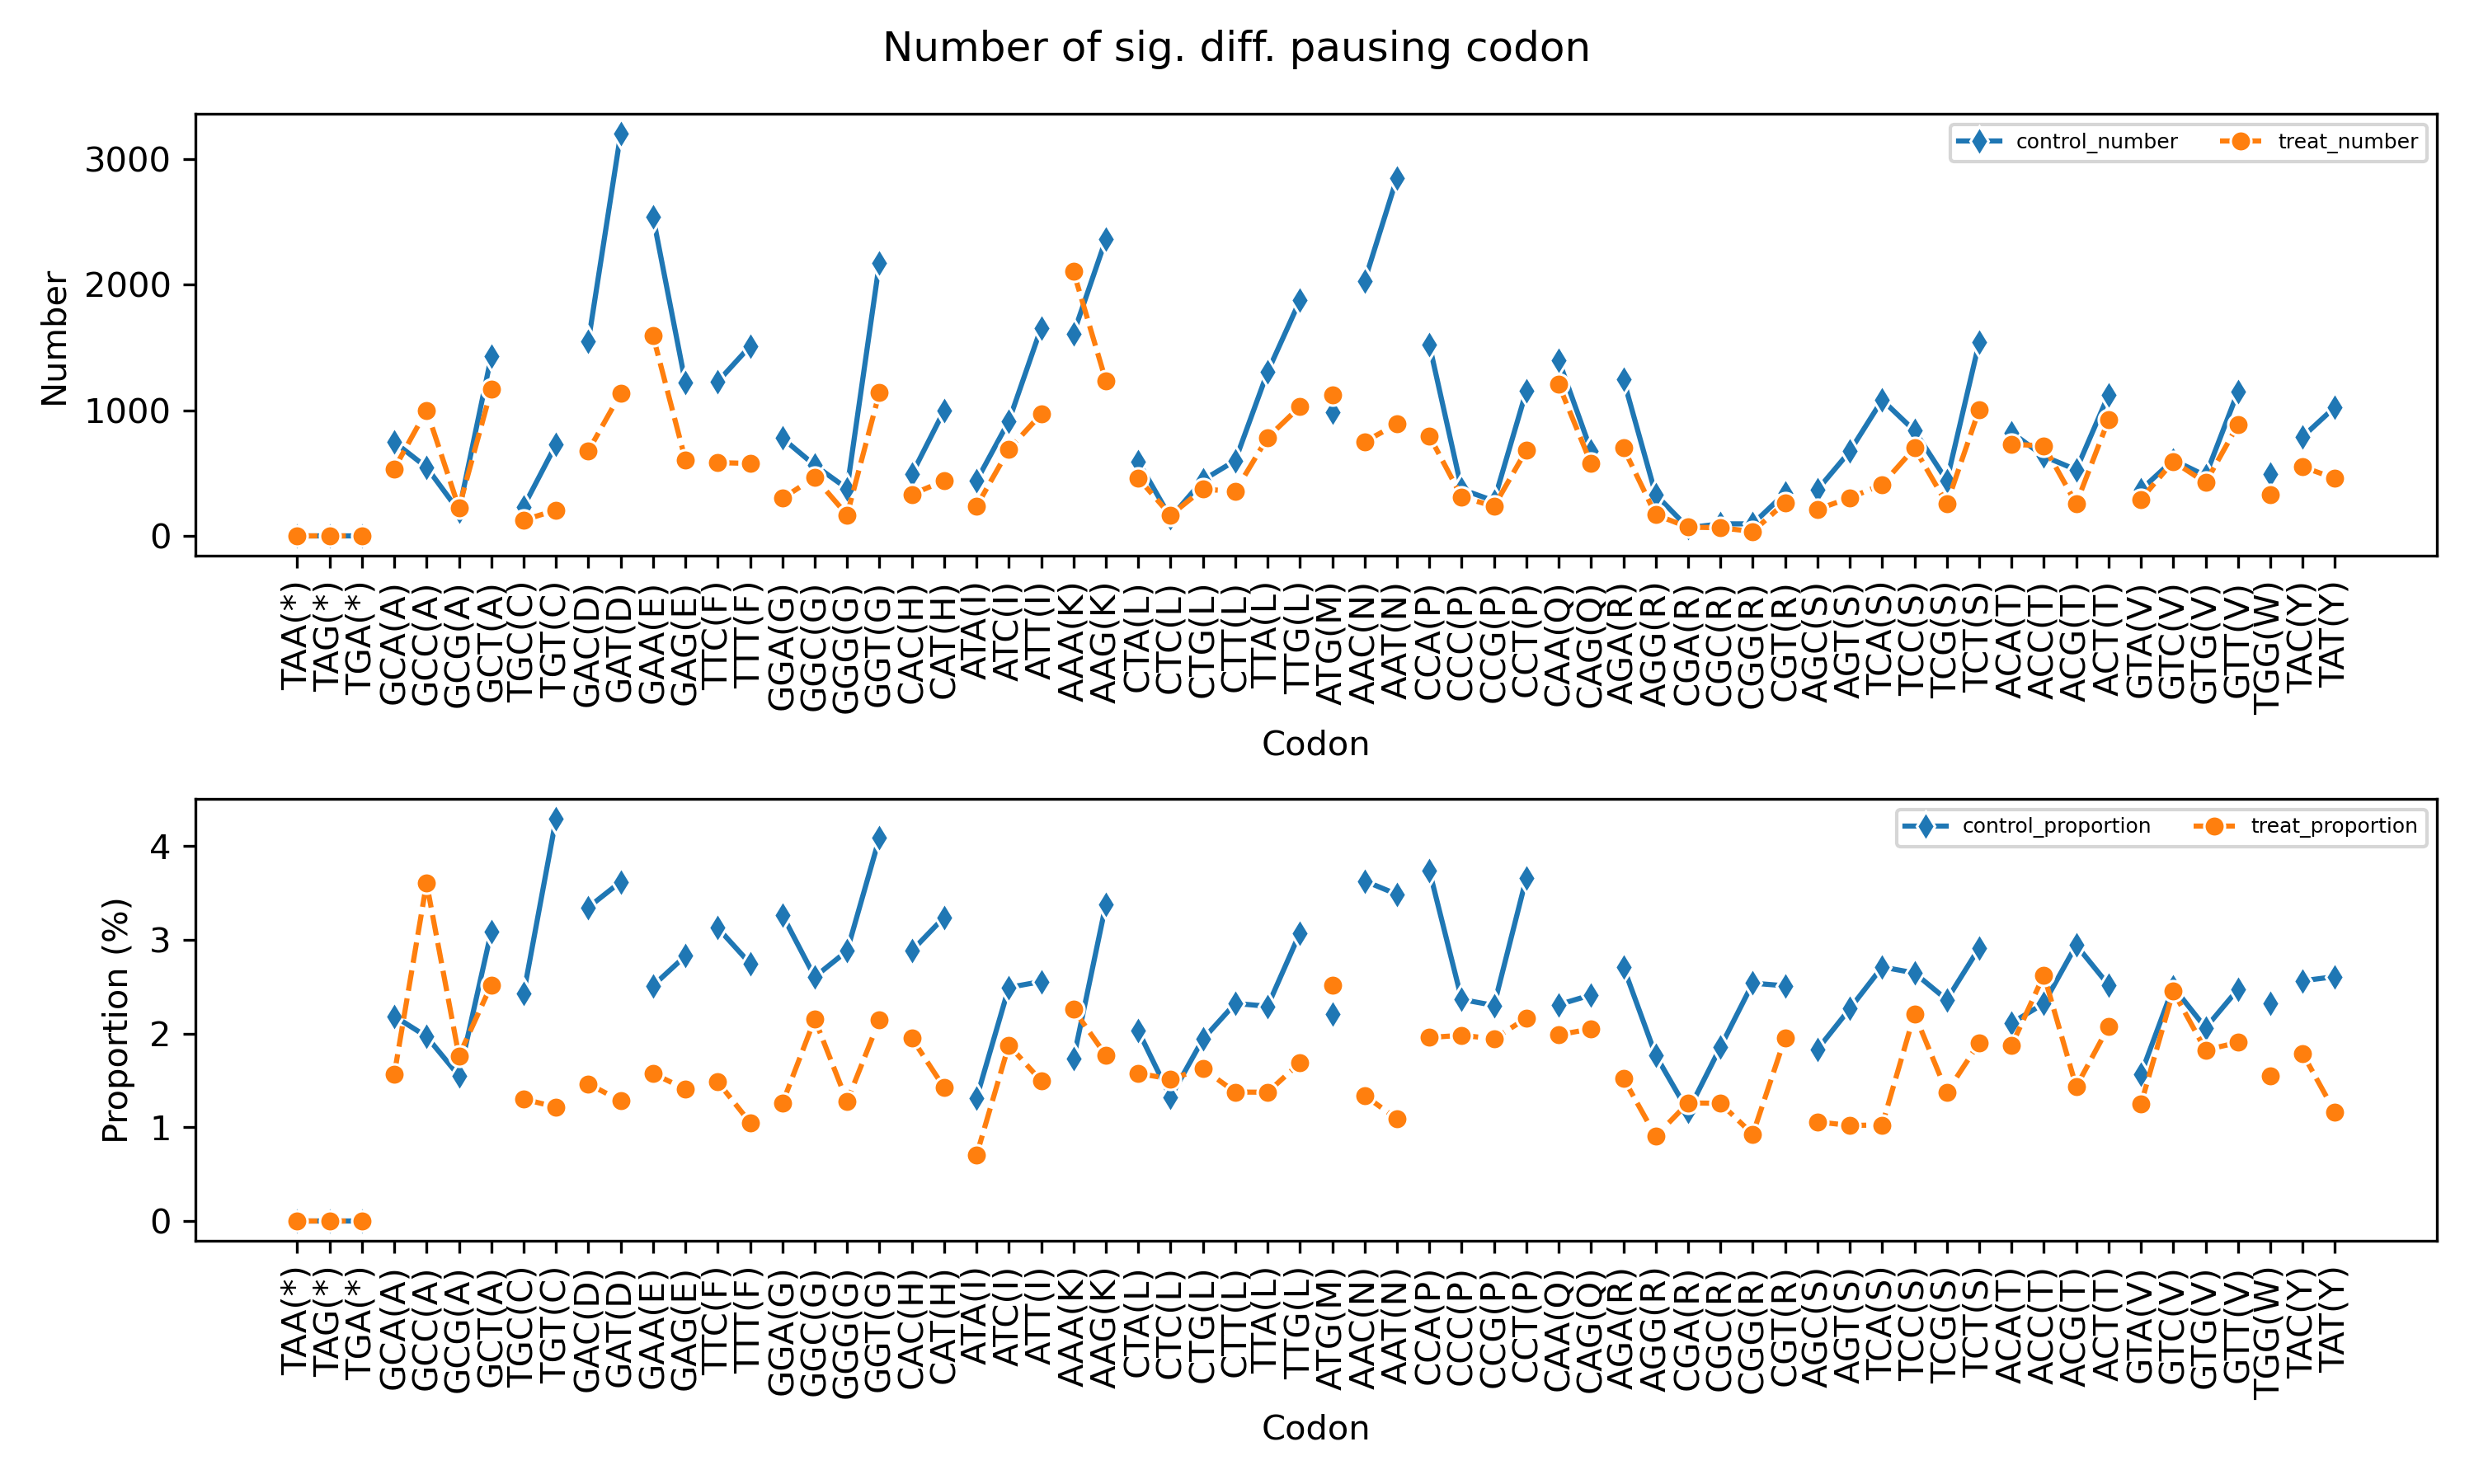
Two panels are shown: the top panel plots the number of significant differential-pausing sites per codon for the control and treatment groups, and the bottom panel plots the same as percentages. Codons are grouped and colored by their amino acid.
2. Scatter plot (sce_odd_scatter.png)
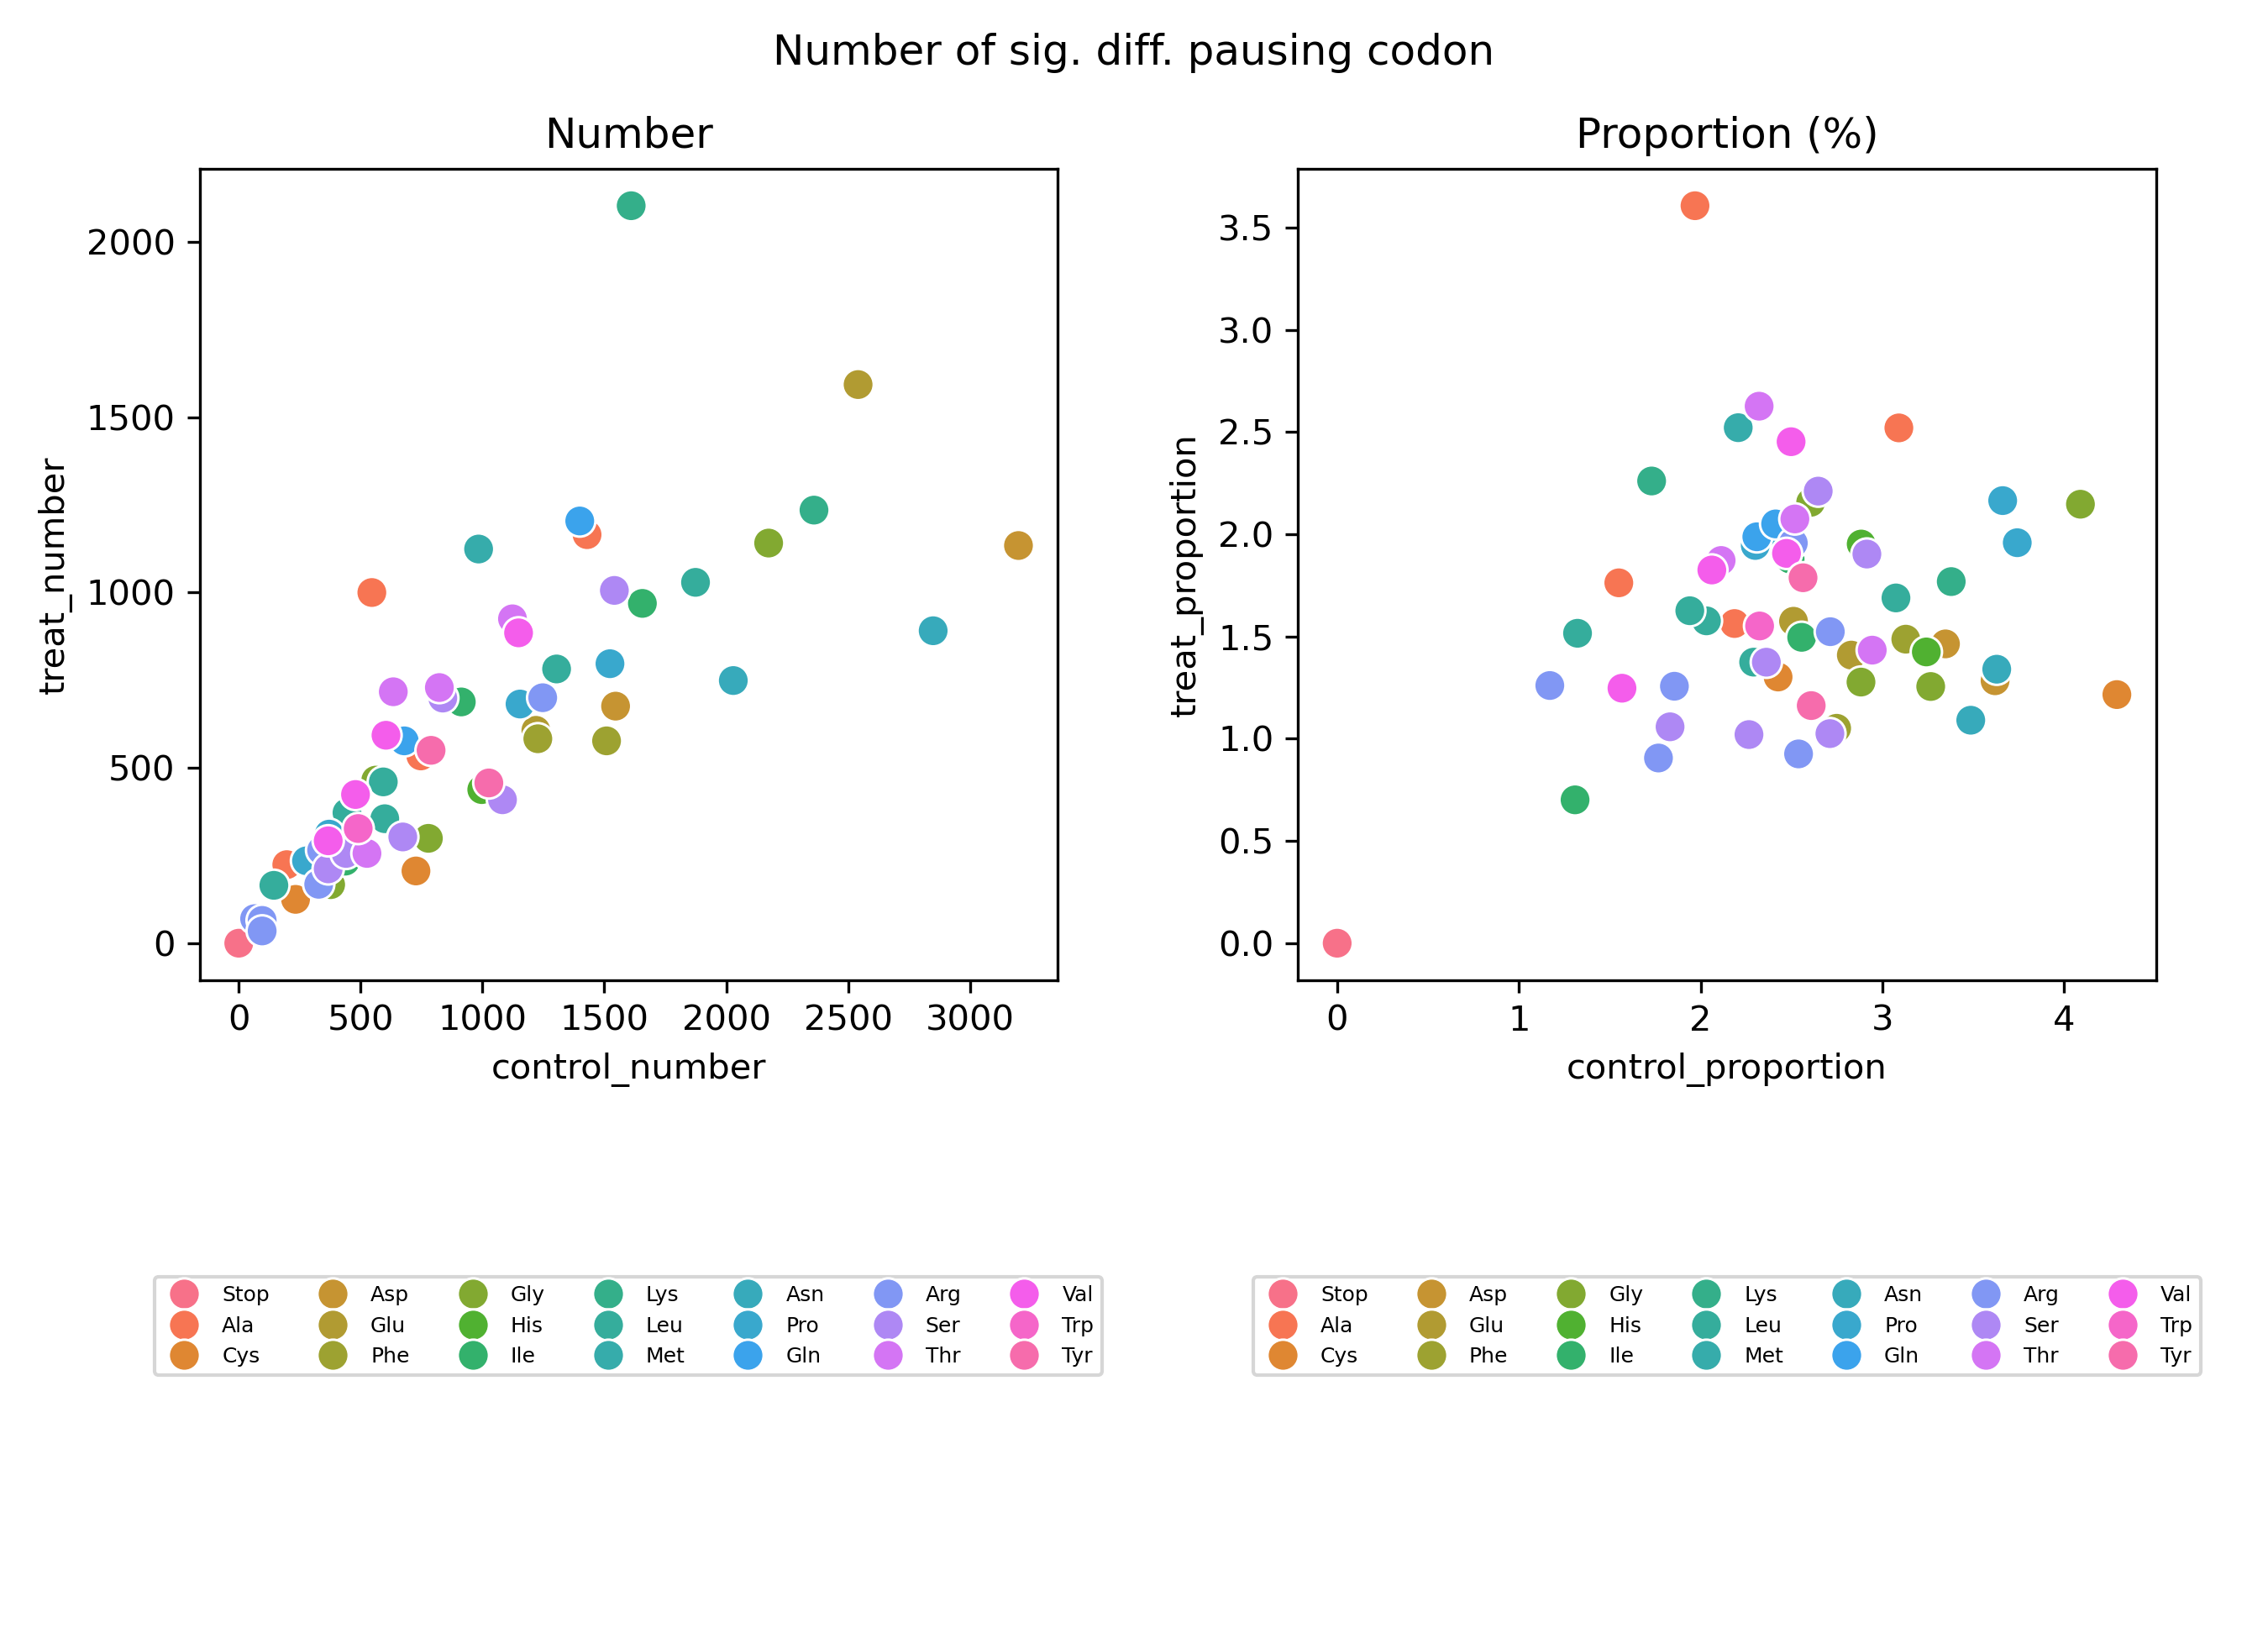
The left panel plots the treatment number against the control number of significant sites per codon, and the right panel plots the corresponding proportions. Points are colored by amino acid; codons above the diagonal have more significant treatment-enriched sites.
Notes
- The sample names provided to
-cand-tmust exactly match sample columns in the merged density file. - The analysis is site-level:
odd > 1means that this specific codon position of this specific transcript is relatively more occupied in the treatment group. Before biological interpretation, verify the raw density at the reportedname/now_nt(orfrom_tis) position in the input density file. - By default (
--stopoff) stop codons are included; enable--stopto removeTAA,TAG, andTGAfrom the analysis. - Use
--fdr bhfdrfor Benjamini-Hochberg FDR filtering or--fdr pvaluefor raw p-value filtering. - The command generates line and scatter plots. An internal barplot function exists but is not called by the command-line workflow.
- Interpret the odds-ratio results together with pausing, occupancy, and read-depth information.
- To visualize the detected local pause sites on the raw RPF profiles, use
rpf_PSplot(see 4.7.9 Pause site plot); its input is the<prefix>_codon_local_pause.txttable produced by this command.
Merge related results
Use merge_odd_ratio to merge multiple codon odds-ratio summary tables:
The merged table is written to <output>_sum_codon_odd_ratio.txt.